
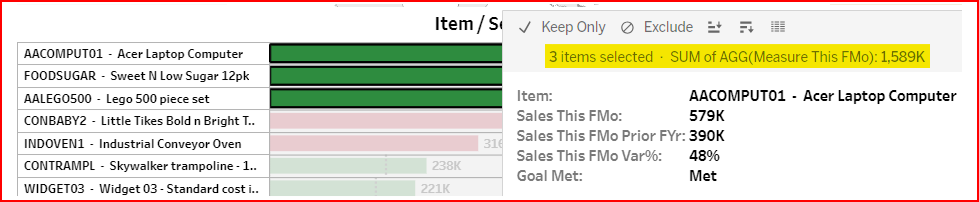
Selecting multiple records to see combined total
When you CTRL-click or SHIFT-click on multiple rows the tooltip menu displays the combined measure value.
On Table views you can click on the Dimension. On Graph/Chart views, click on the graphical measure.
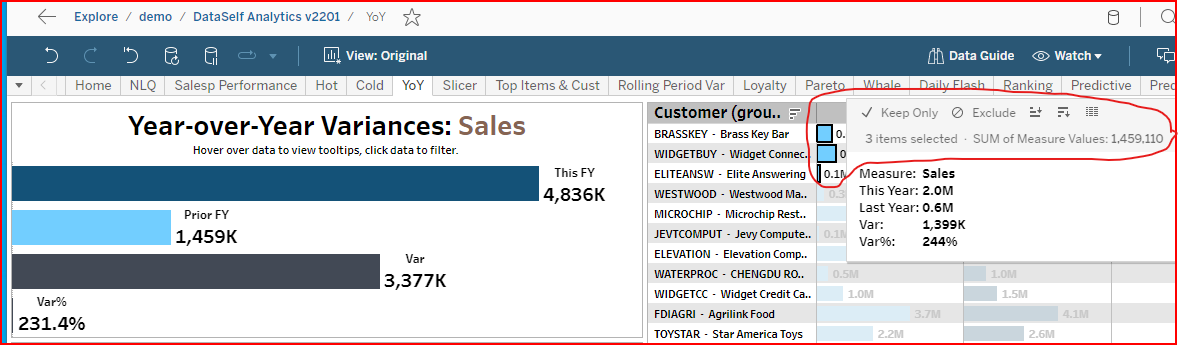
Prior FY graphic to select 3 records. The Sum of Measure Values shows 3 items selected and the total of the selected measures on the view. Note that the sum value is of all 3 measure fields per row, not a single measure field.
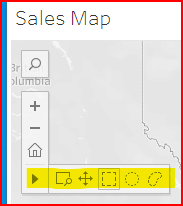
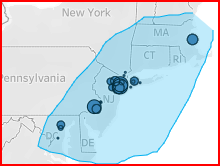
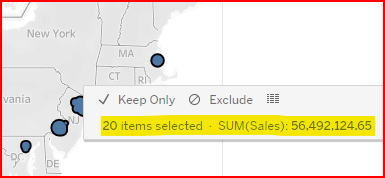
On a map view there is a selection tool available to select by square, circle, or ad-hoc shape. When you hold down the mouse button and drag across the selected areas the tool tip shows the combined measure amount.
|
|
|
Creating Custom Views to save your settings
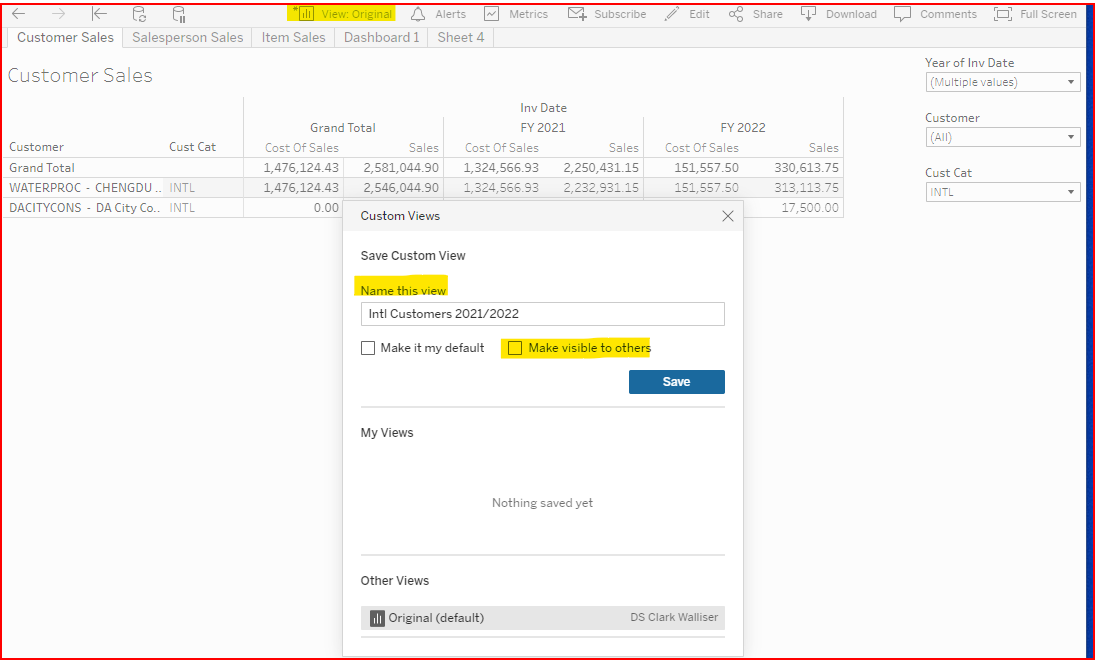
Once you choose your selection and other criteria, you can save your settings as a custom View.
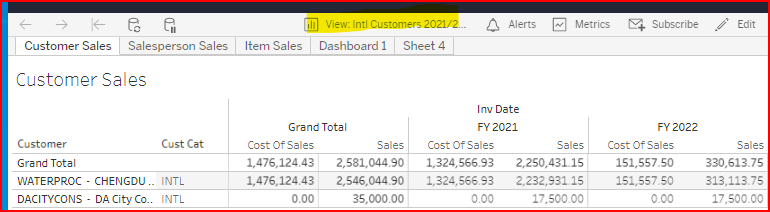
Click on the menu item View:Original to display the View dialog window. Give your view a name and select if others may see this saved view also. when you click on Save you can then select from either Original or your saved view settings.
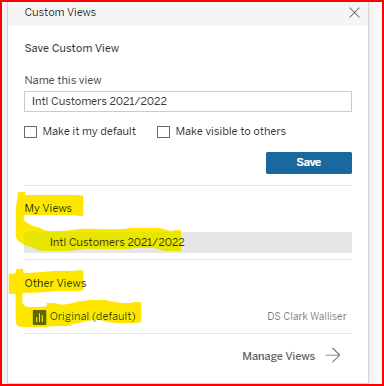
Custom views are also handy when downloading or subscribing a view. You can select the specific custom view with the custom settings in place.
Using the worksheet filters:
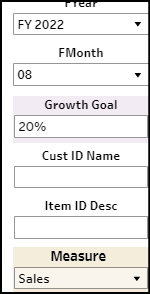
|