Table Calculations - the next level
Table calculations
Tableau help links:
Transform Values with Table Calculations - Tableau, Table Calculation Functions - Tableau,
Top 10 Tableau table calculations, Table Calculation Functions - Tableau
Table calculations compute using the data on the screen rather than the data in the dataset.
The most commonly used table calculations are: Difference, % Difference, Rank, % Total, Running Total
You can modify the Table calculation to either look at the entire table of data on the screen, or only scan data within a specific pane at a time.
Table calculations can go from basic to complex very quickly. The help topics listed above are for those who want to go beyond the common uses.
Using Table Calculations for Totals and Sub Totals
In cases where the Dimension field used in the calculation is not on the worksheet, then an LOD calculation can work in place of a Table Calculation.
Activity: Create Table Calculations to show % of set, and % of grand total.
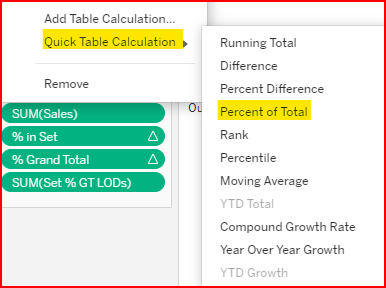
Convert the Sum (Sales) Measure Value to a Quick Table Calculation % of Grand total.

Convert Sum (Sales) to a Quick Table Calculation

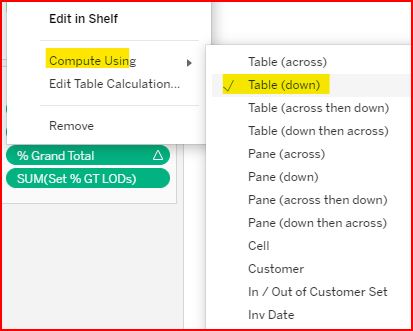
For % of Grand total choose Table (down)
Save the Table Calculation to the Data Pane and rename it % Grand Total. Then replace the original Table Calculation. Add the Sum (Sales) again.
Convert the Sum (Sales) Measure Value to a Quick Table Calculation % of Set Total
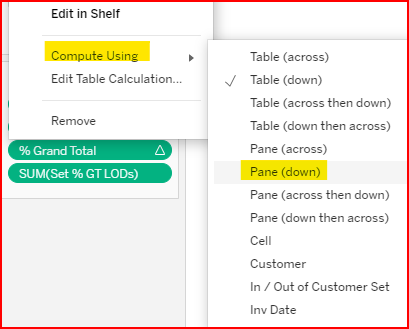
Then edit the Table Calculation to compute using Pane (down).

Convert Sum (Sales) to a Quick Table Calculation

For % of Set Total choose Pane (down)
Save the Table Calculation to the Data Pane and rename it % Set Total. Then replace the original Table Calculation. Finally, add the Sum (Sales) again.
Manually creating Table Calculations
Table Calculations are made of three parts: The calculation functions, the address (scope/grouping of data), and partition (direction).
Using LODs instead of Table Calculations to show the Set subtotal as a percent of grand total.
An alternative to using a Table Calculation to calculate the % Grand Total is to use an LOD calculation. The example below is for reference.
Duplicate the worksheet you created for the Set Actions
Create an LOD calculated field to show the Sum (Sales) per Customer Set output (IN/OUT)

LOD (including YEAR) to show sum of sales per Customer Set
Create another LOD calculation to show the grand total of sales per year.

LOD (including YEAR) to show grand total of sales
Create a regular calculated field to show sales per Customer Set / Sales Grand Total

Calculated field Sales per customer set / sales grand total percent
Note: an important characteristic of a Fixed LOD calculation is that it processes before dimension filters process. For example, if you use a filter to select only specific items, the LOD will still calculate based on the sales for all items. Converting a Dimension filter to a Context filter addresses this.
