DataSelf Analytics Essentials Templates for ERP
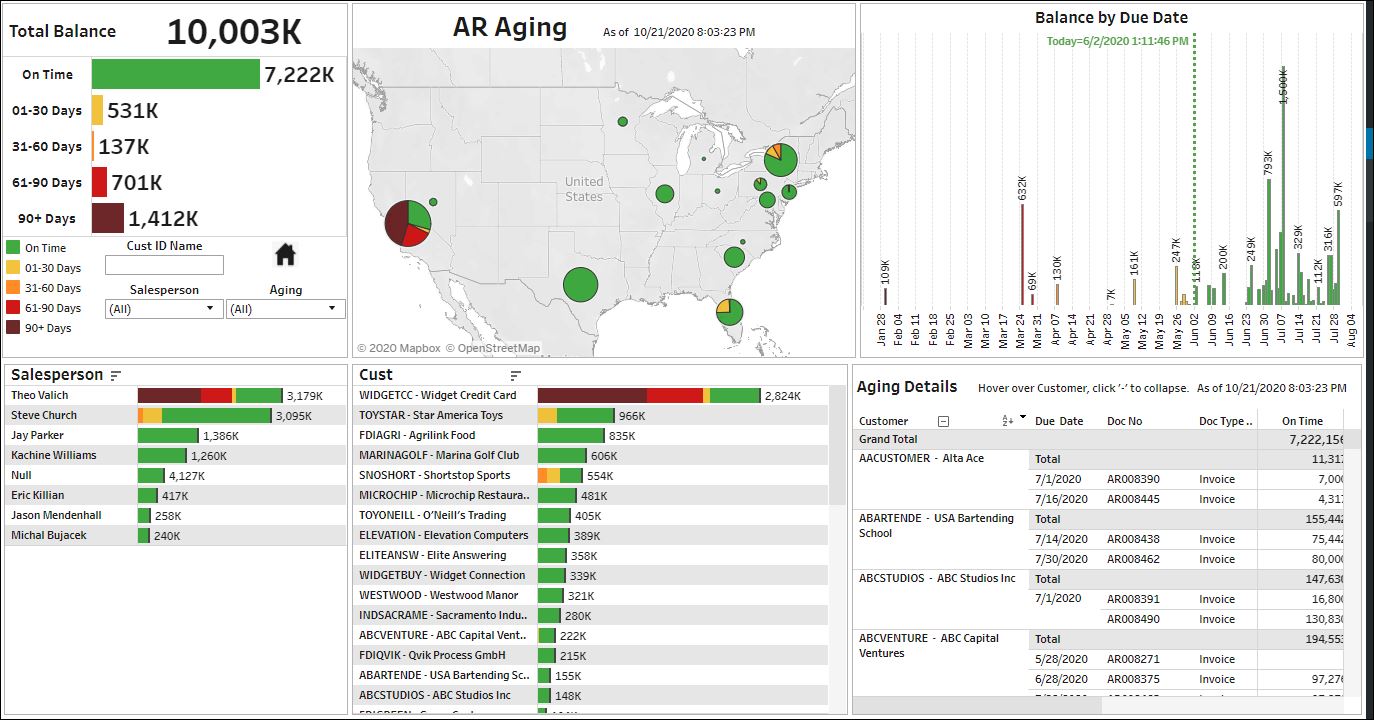
AR Aging Today
AR Aging Today
High-level overview and detail information about your AR Aging.
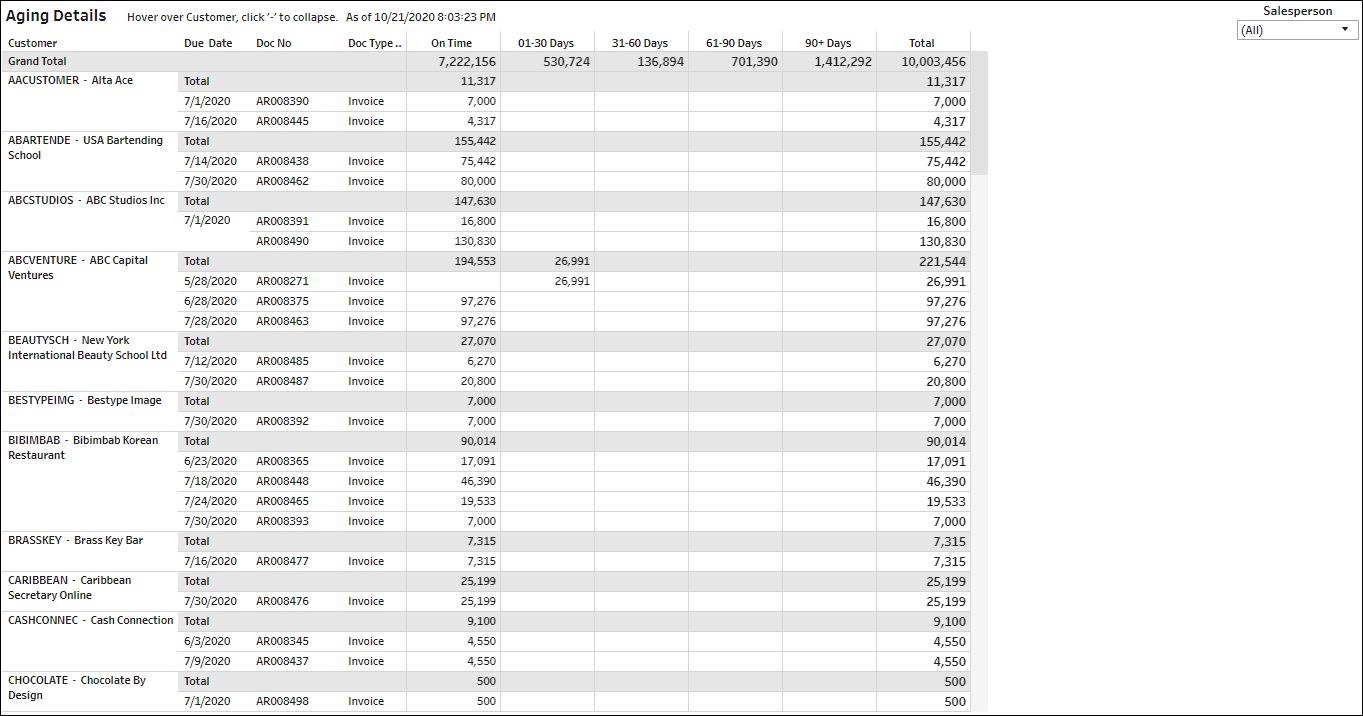
AR Aging Today Details
Easily analyze and slice and dice your detailed open AR Aging information.
GL Transactions
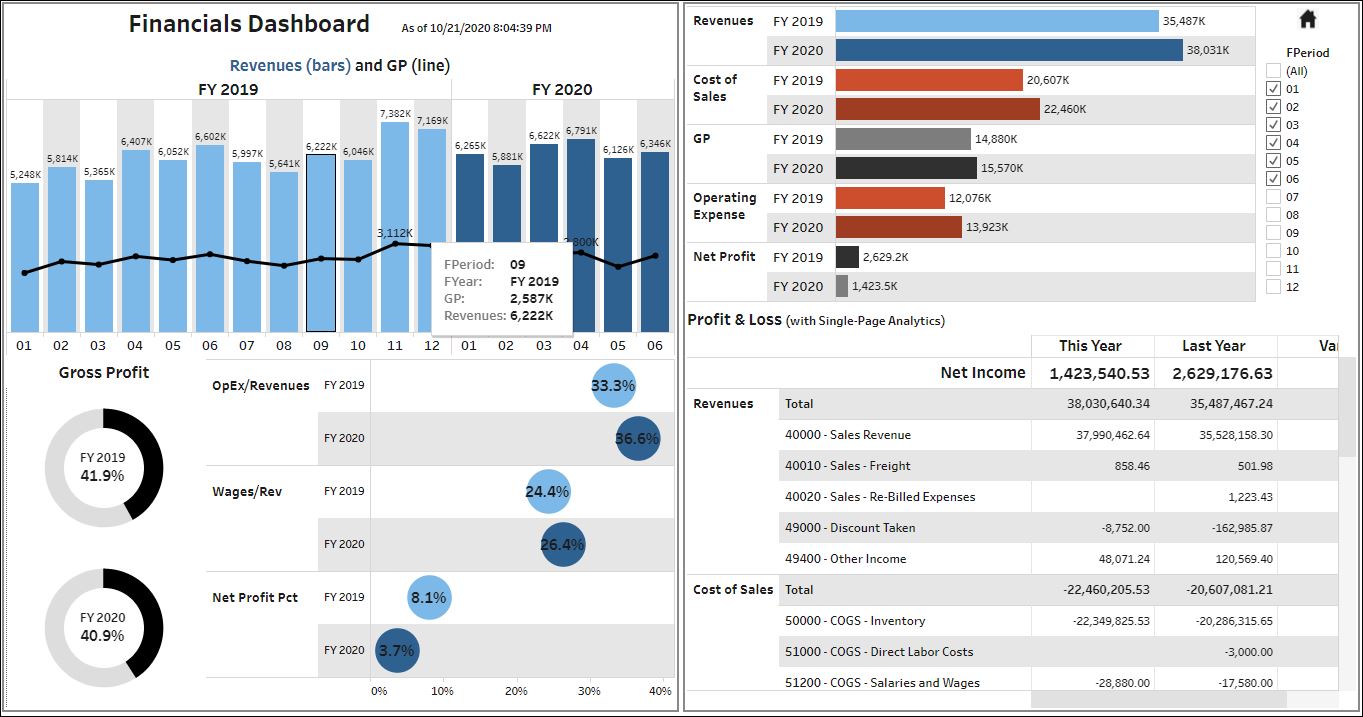
Financials Dashboard
Easily plot and slice and dice your GL KPIs.
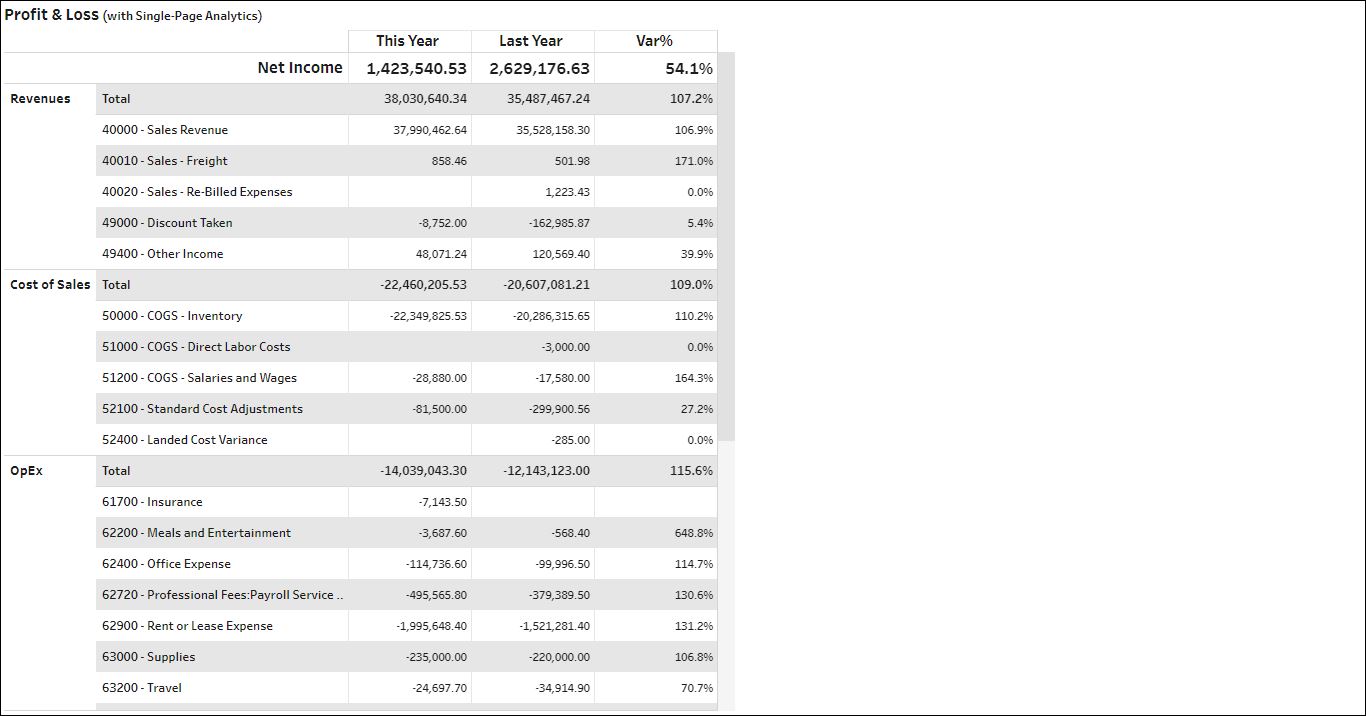
Profit & Loss Watcher
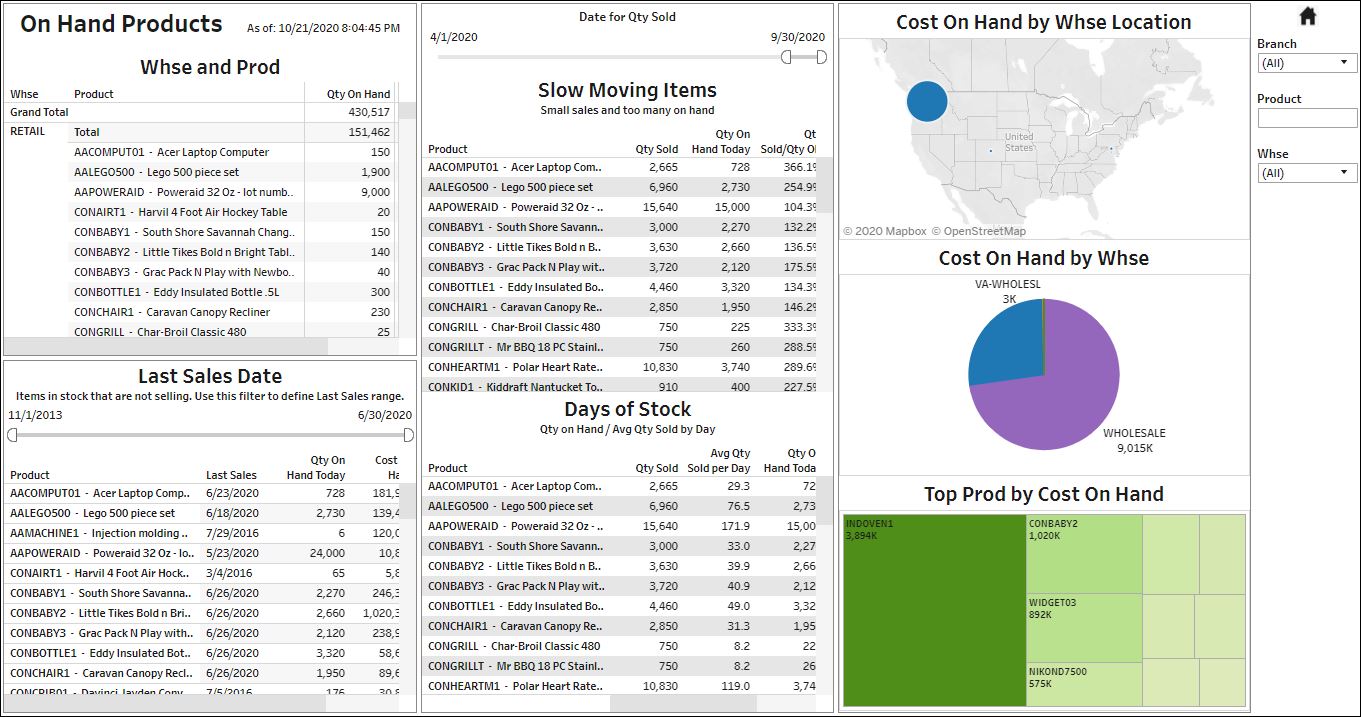
Inventory On Hand Today
What’s available to ship today, simple projection of how many days of stock is available by item, and ways to assess slow-moving items.
Purchase Order
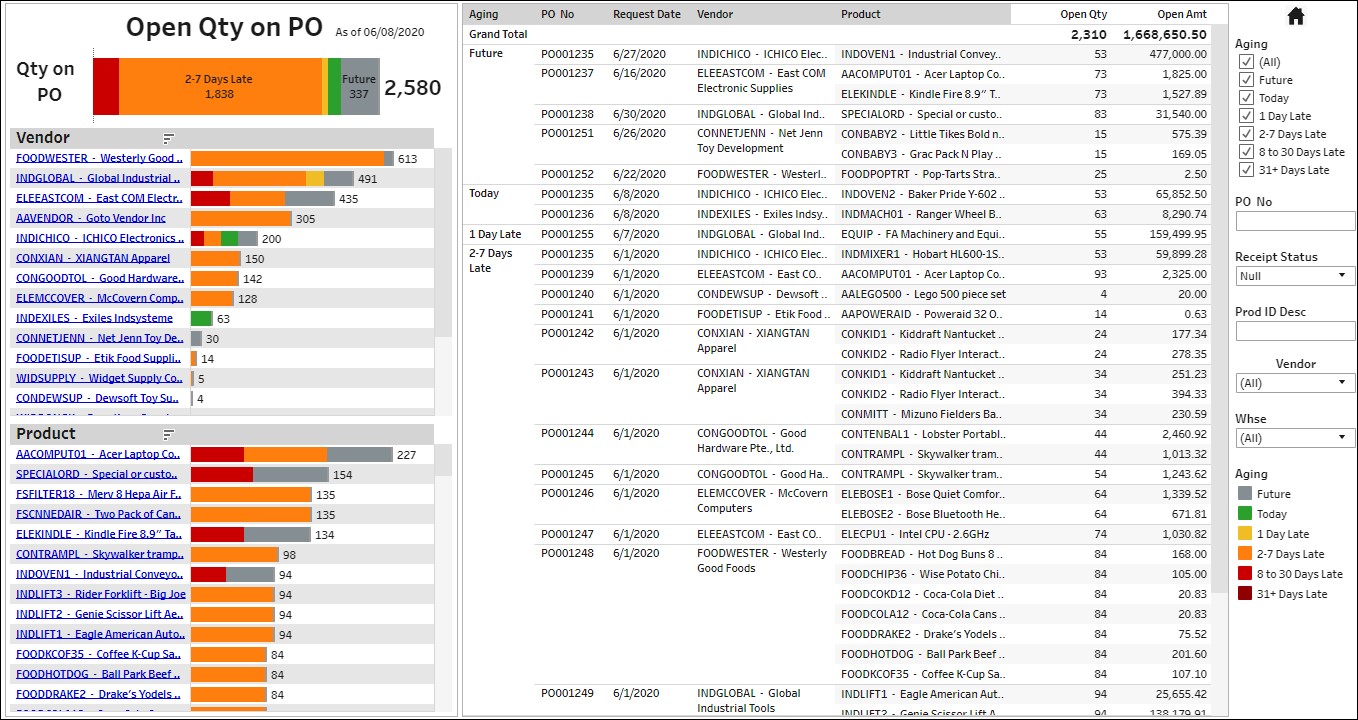
Open PO Dashboard
High-level overview and detail information about your open POs.
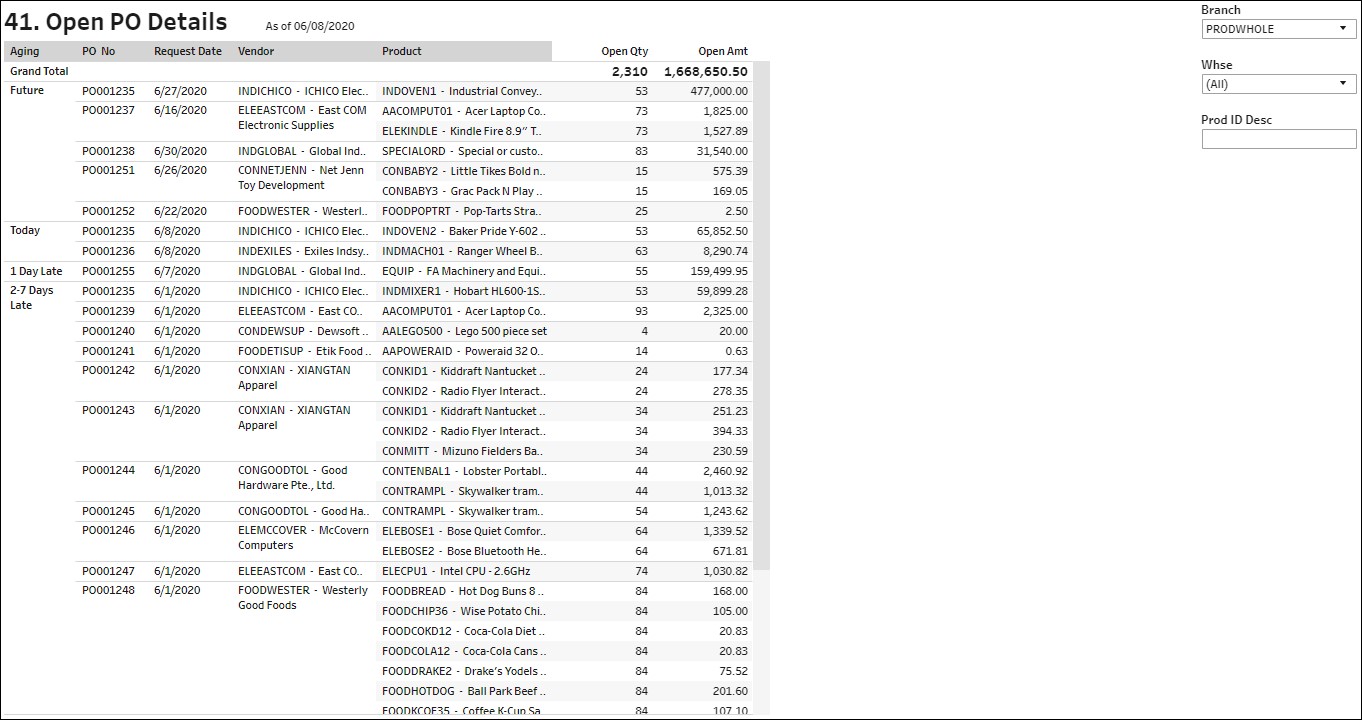
Open PO Details
Easily analyze and slice and dice your detailed open PO information.
Sales Order
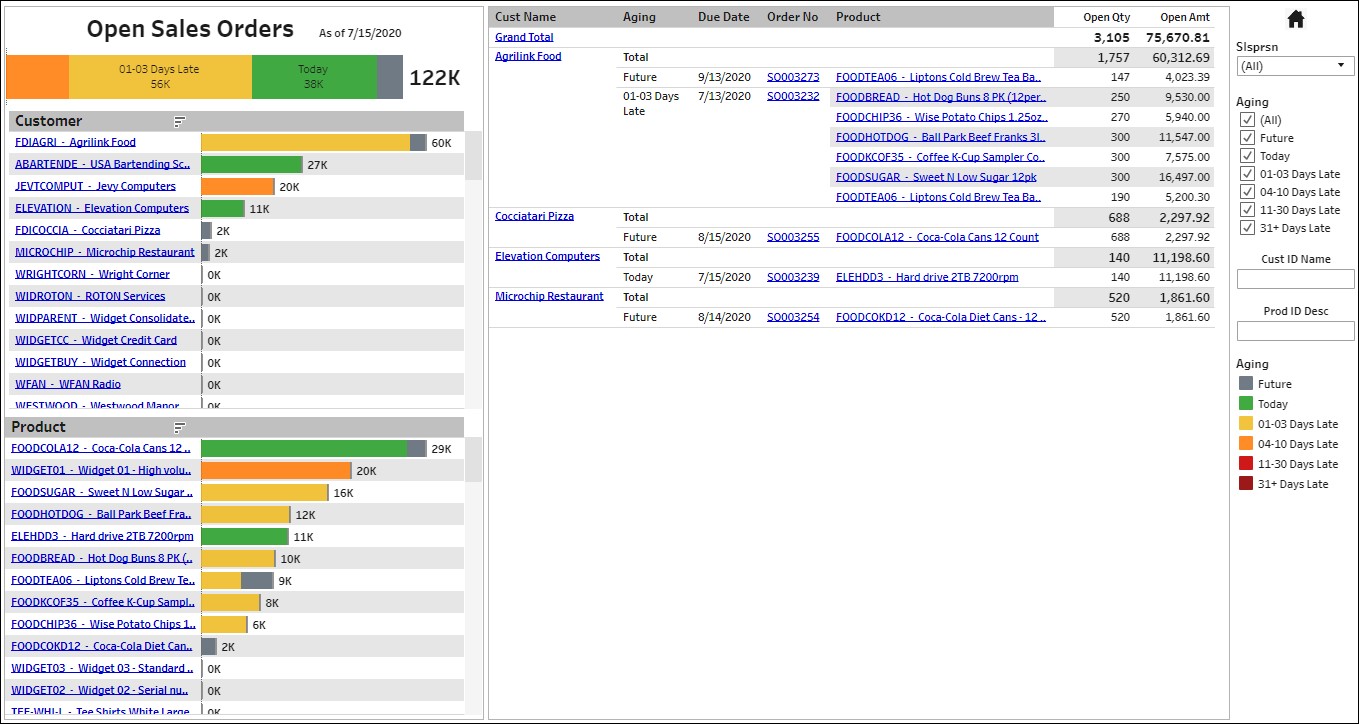
Open Sales Order Dashboard
High-level overview and detail information about your open SOs.
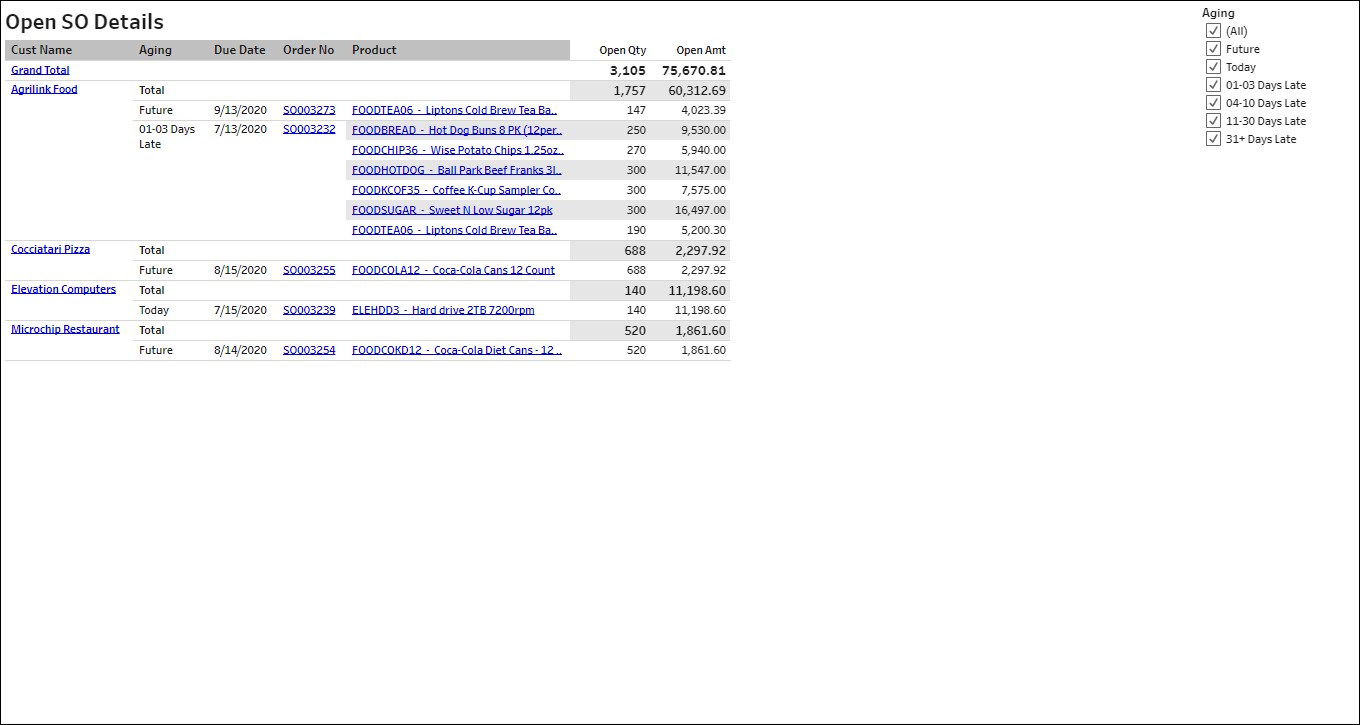
Open Sales Order Details
Easily analyze and slice and dice your detailed open SO information.
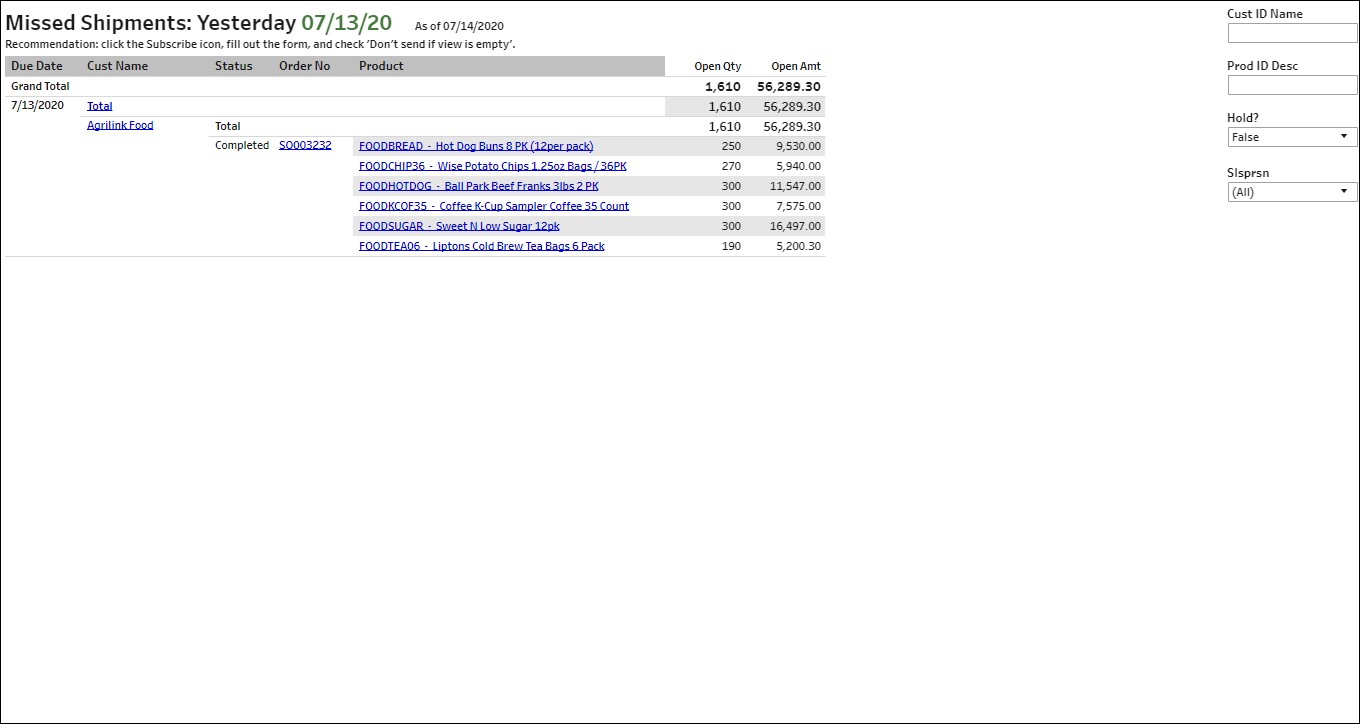
Missed Shipments
Which items didn’t ship yesterday? You can also set up alerts for notifying only when orders haven’t been shipped.
Sales Invoice
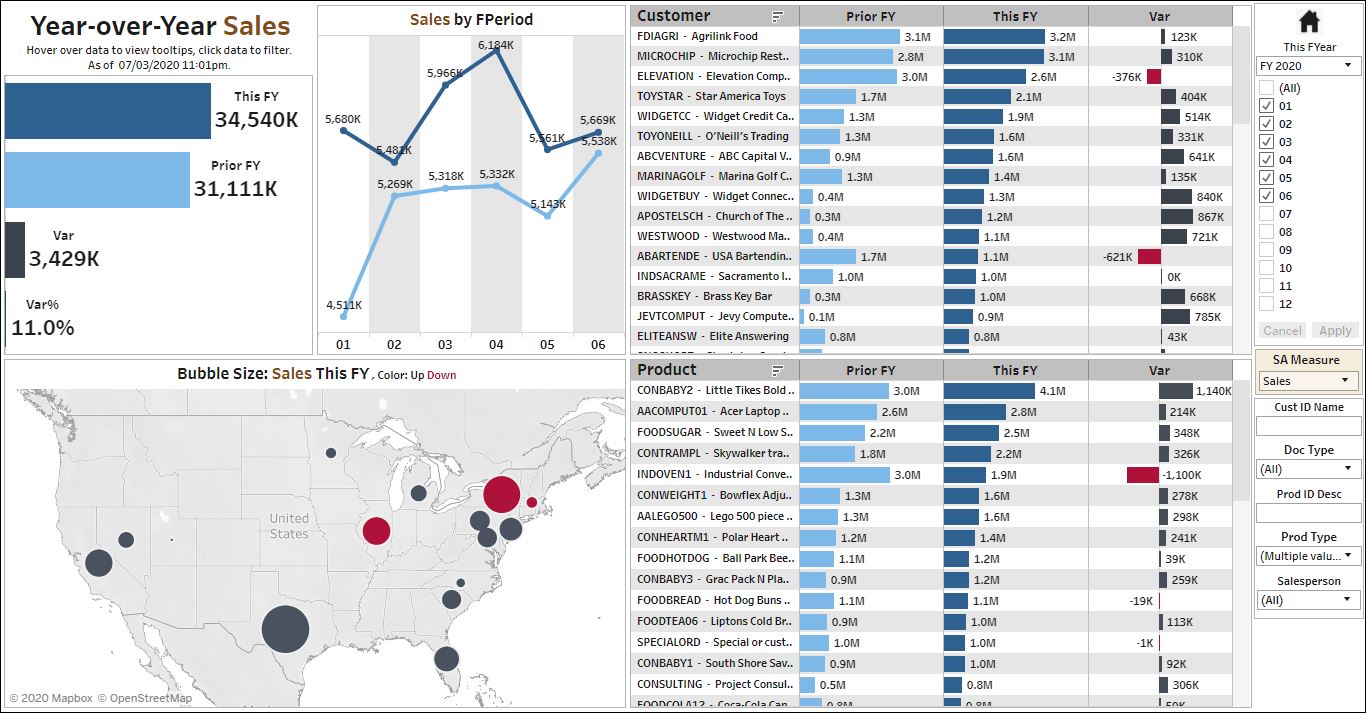
Year over Year Sales
Easy and extensive ways to slice and dice sales information in this year, as well as comparing to the same period last year.
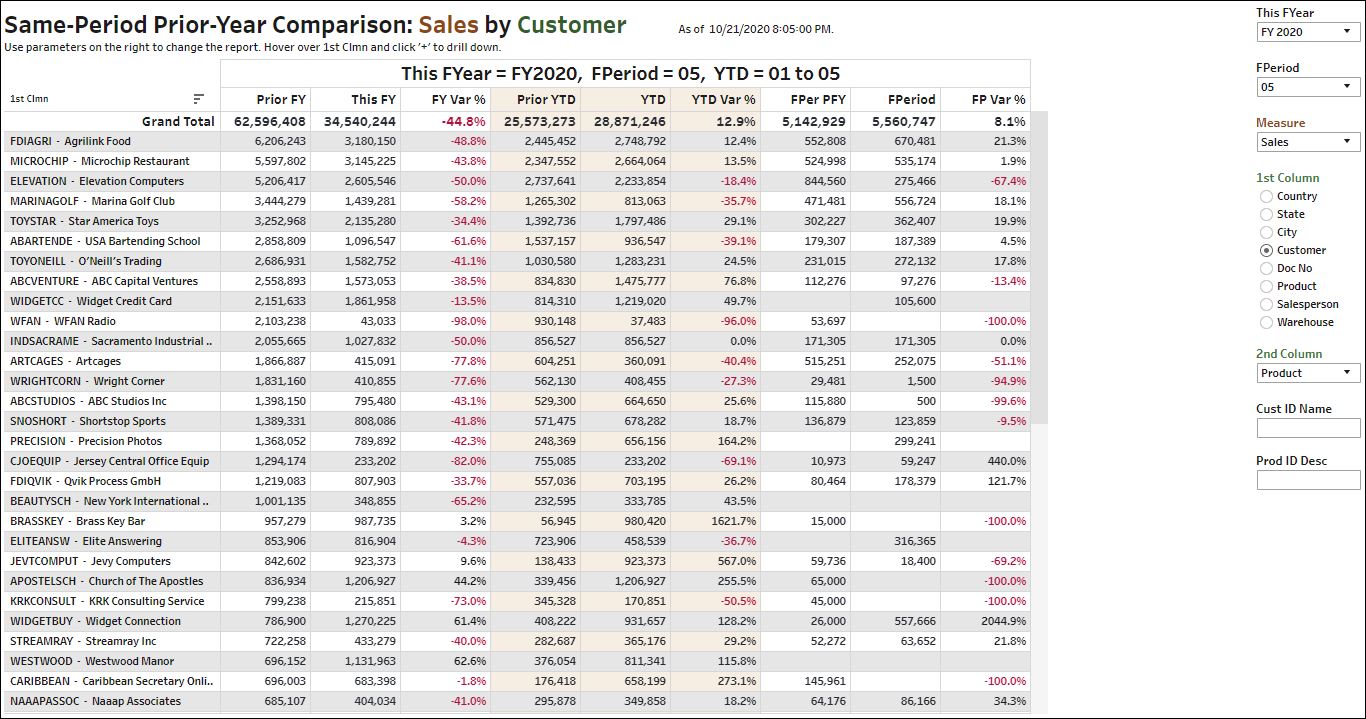
Same-Period Prior-Year Comparison
Use parameters on the right to change the report. Hover over 1st Clmn and click ‘+’ to drill down.
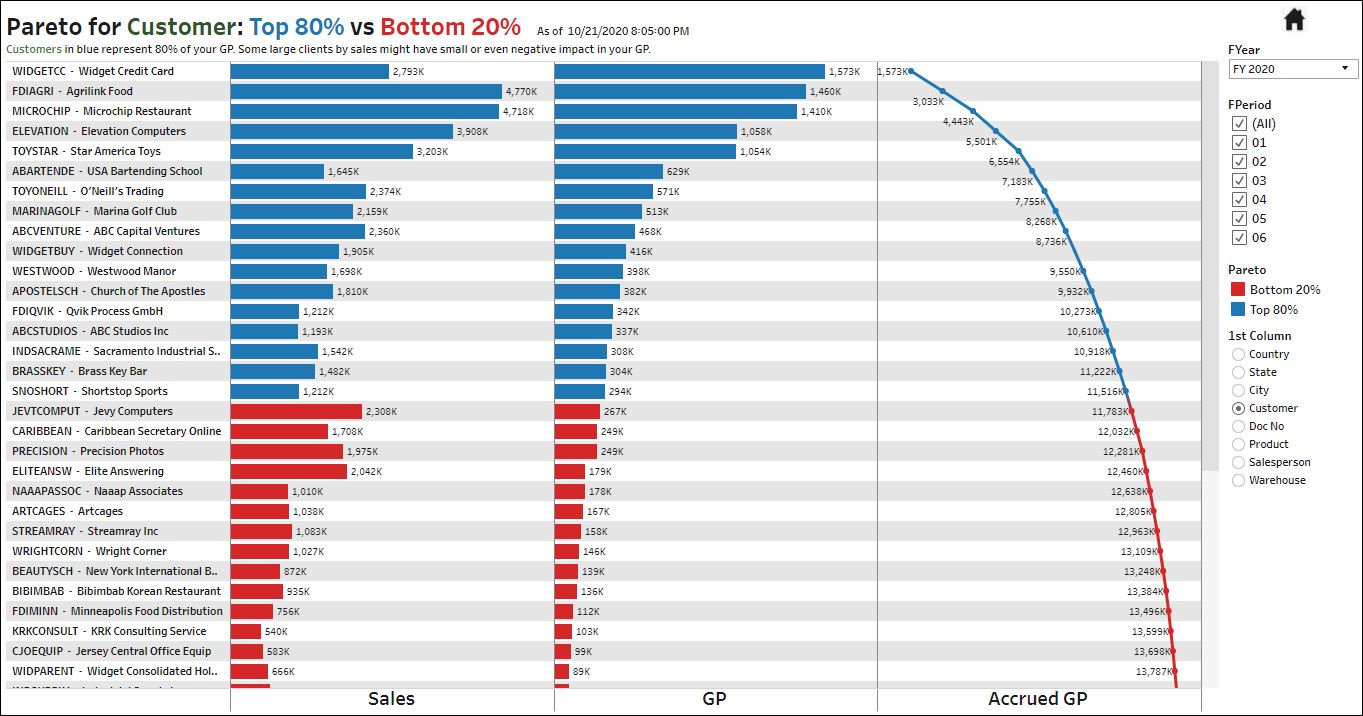
Pareto Report
Entries in blue represent 80% of your GP. Why some large entries by have small or even negative impact in your GP. Use parameters on the right to set entries as customers, products, regions, etc.
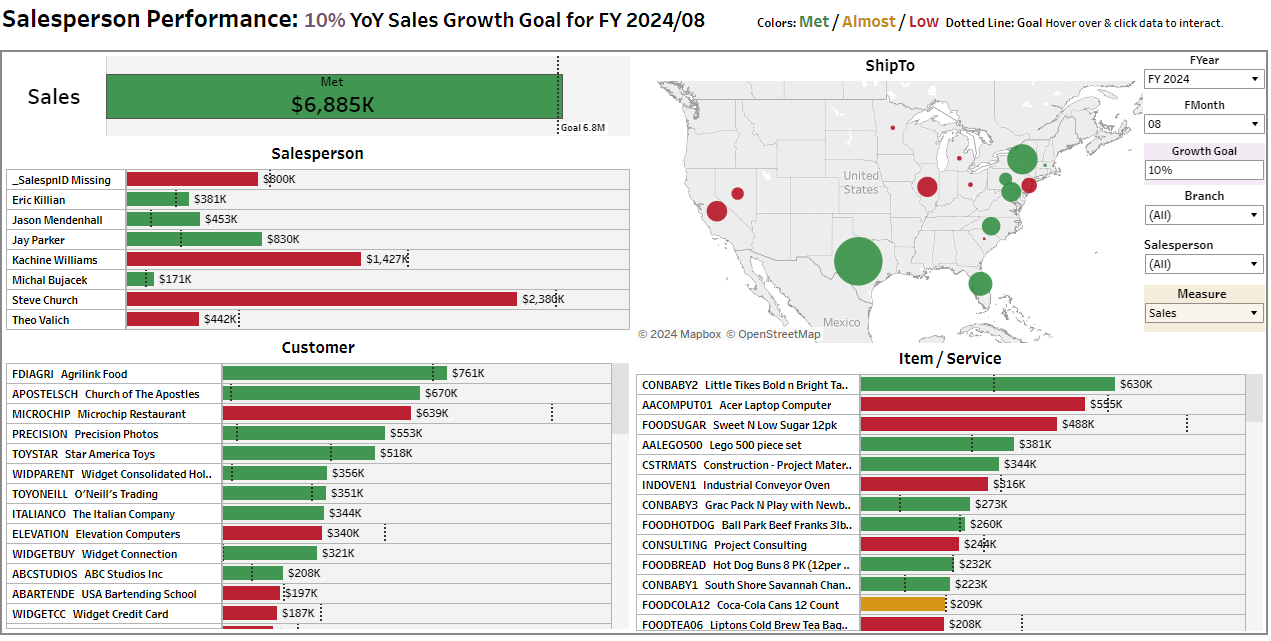
Salesperson Dashboard
Provides a 360-degree view of customer touch points. This example requires Sales, CRM Opportunities, AR Aging, and Email Marketing.
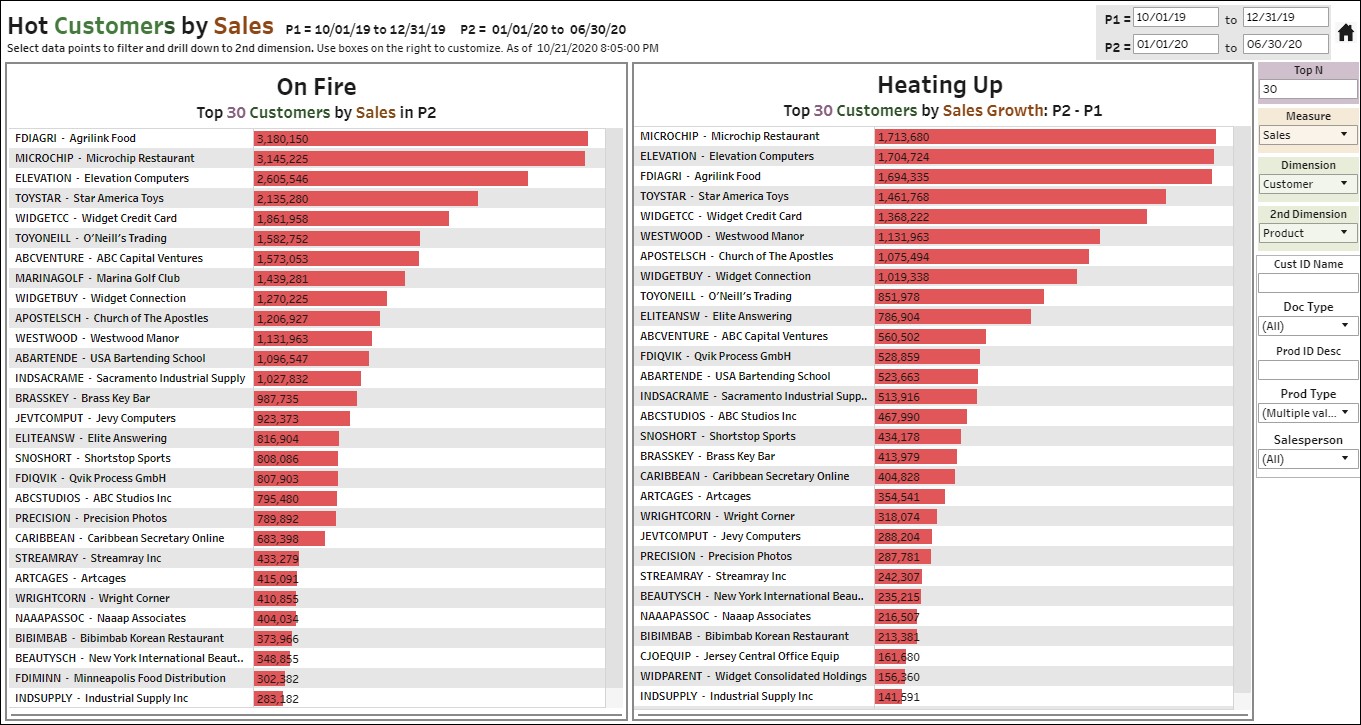
Hot and Cold Performers
Shows the biggest performers, and the ones growing the most. Select data points to filter and drill down to 2nd dimension. Use boxes on the right to customize.
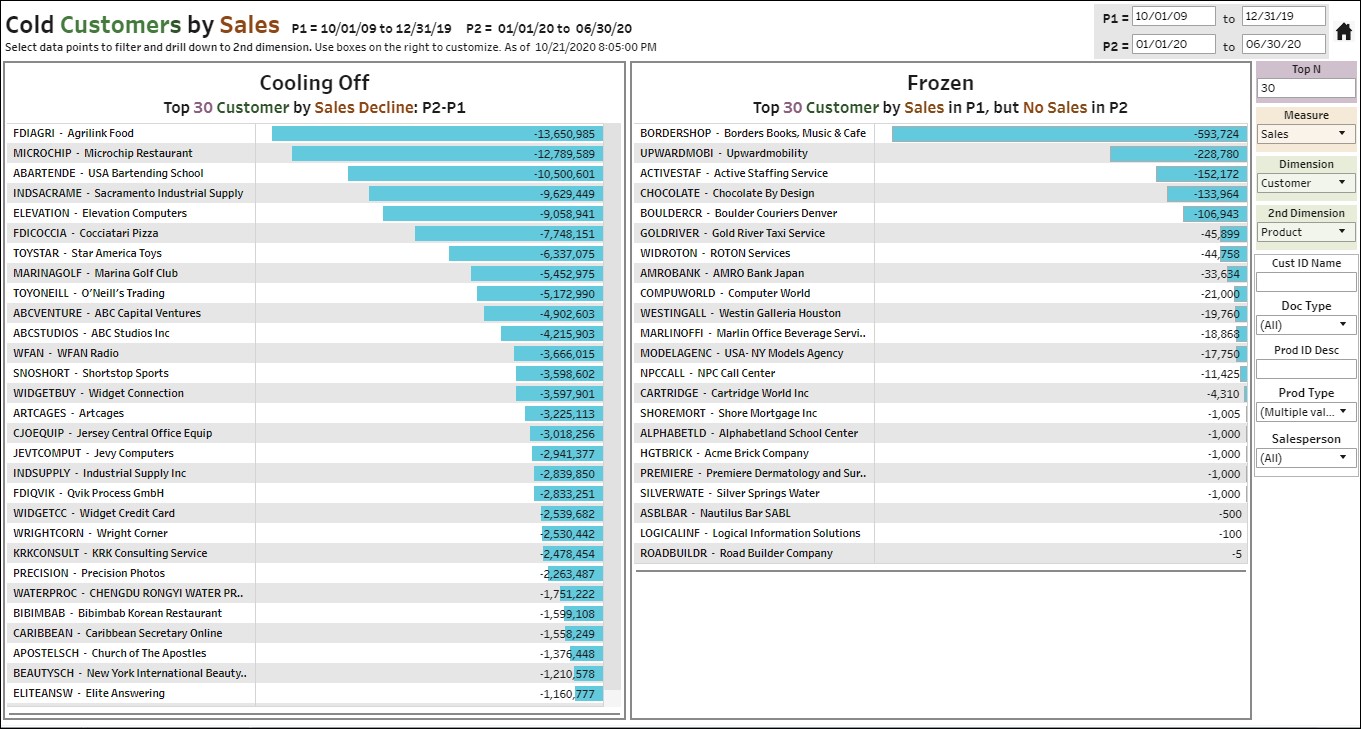
Shows the performers with the biggest declines and the ones no longer generating sales. Use boxes on the right to customize.
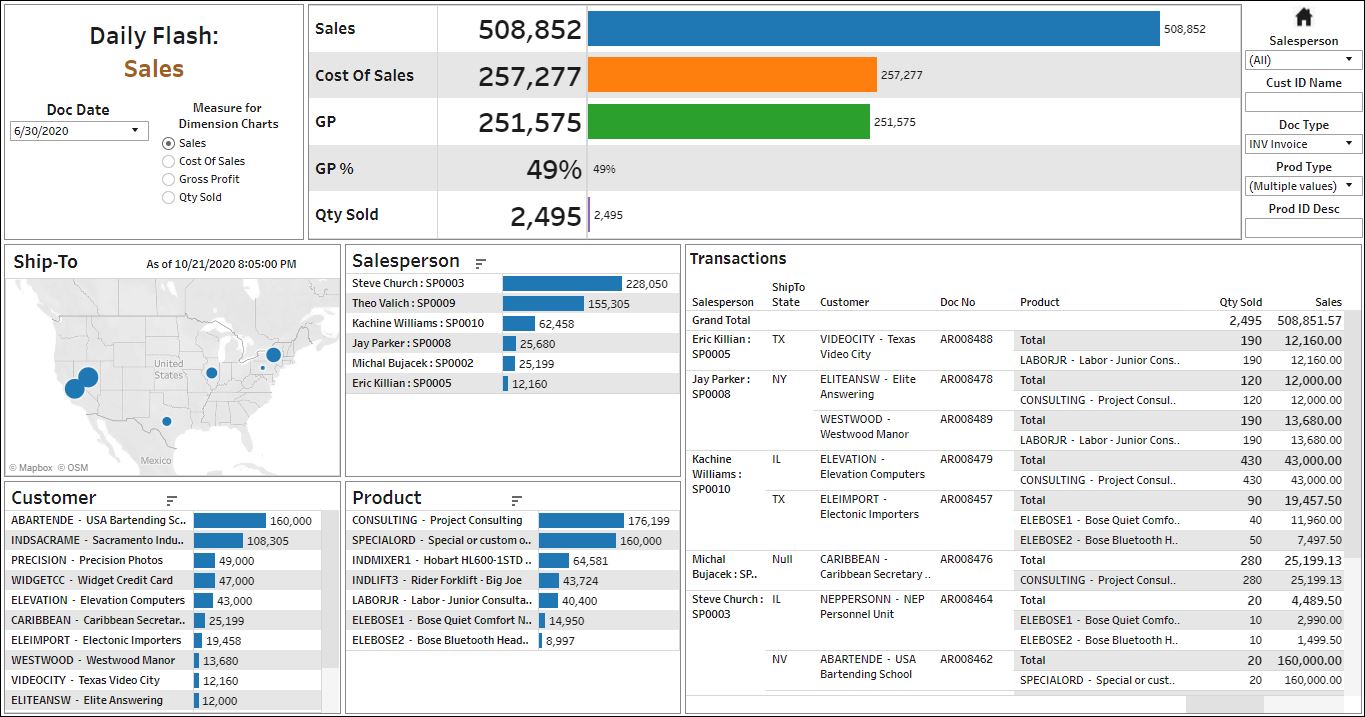
Daily Flash
Keep track of important threats and opportunities as they happen.
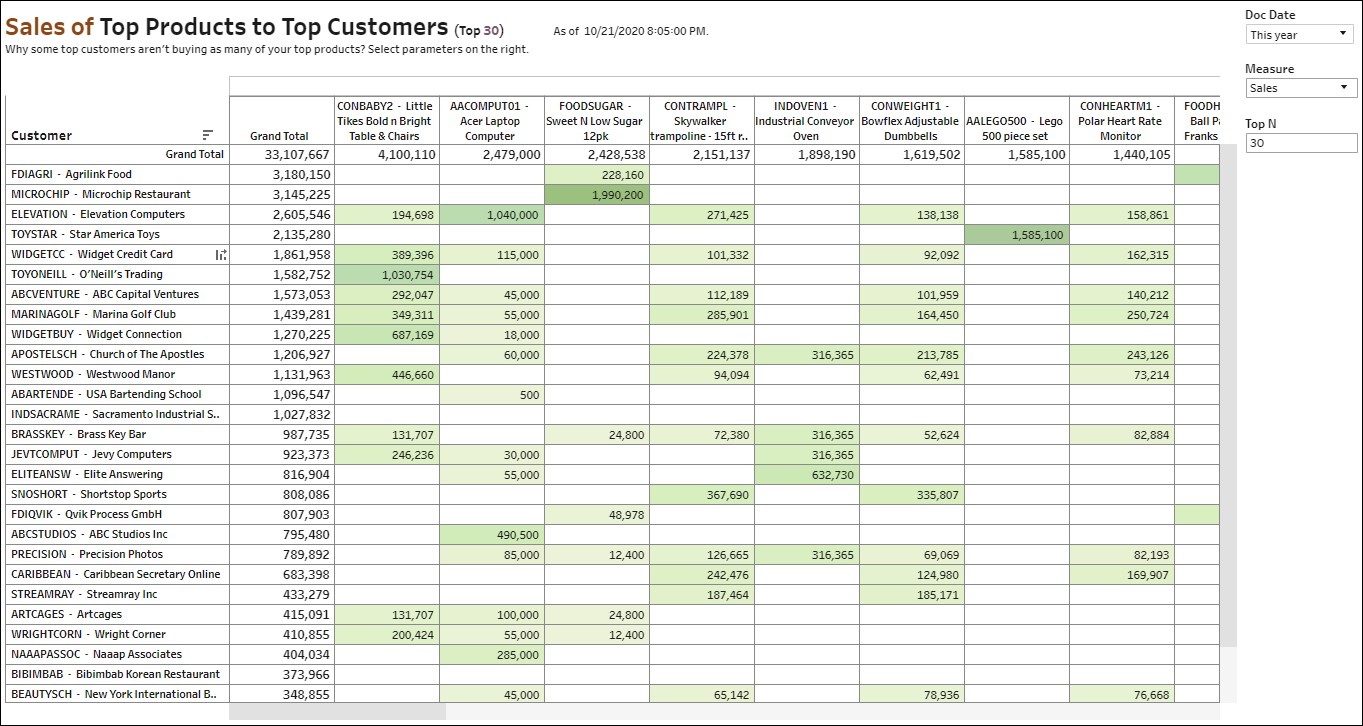
Sales of Top Products to Top Customers
Why some top customers aren’t buying as many of your top products? Select parameters on the right.
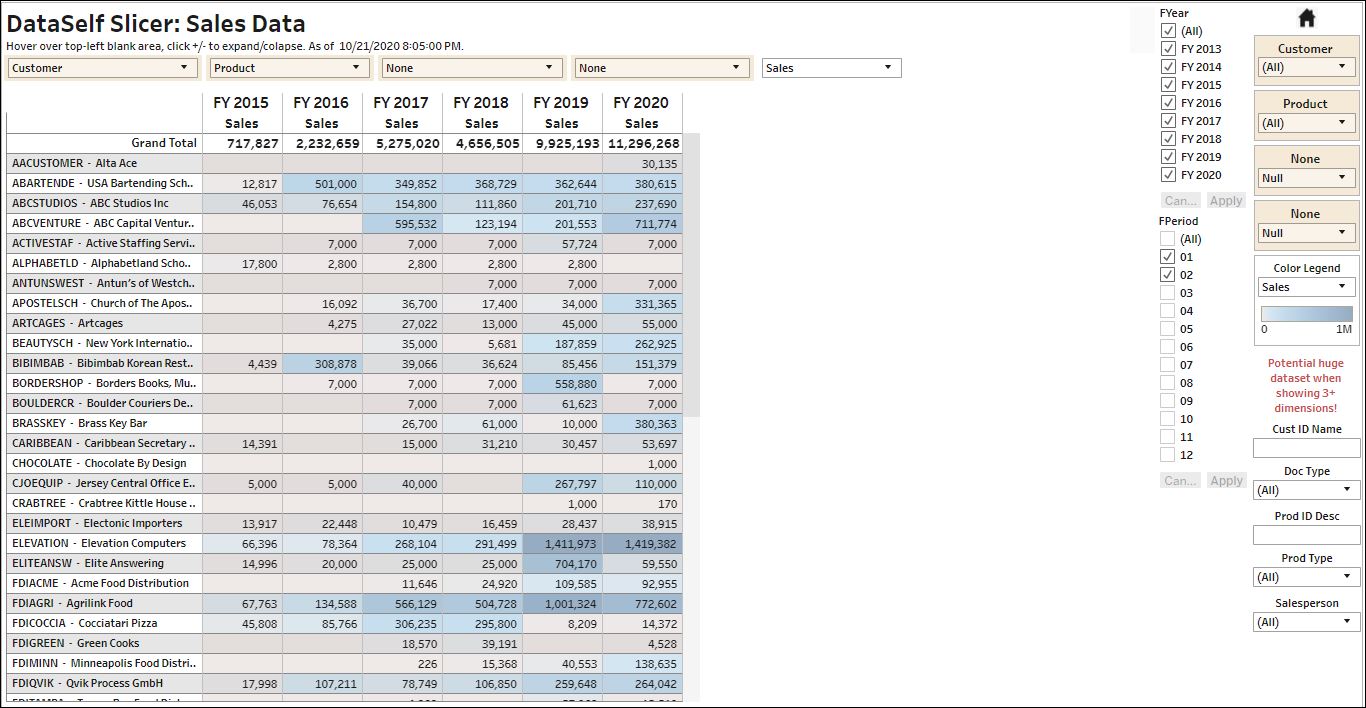
DataSelf Sales Slicer
Users with the Viewer license can extensively slice and dice their sales data by using the dropdown lists and hovering over top-left blank area, clicking +/- to expand/collapse.
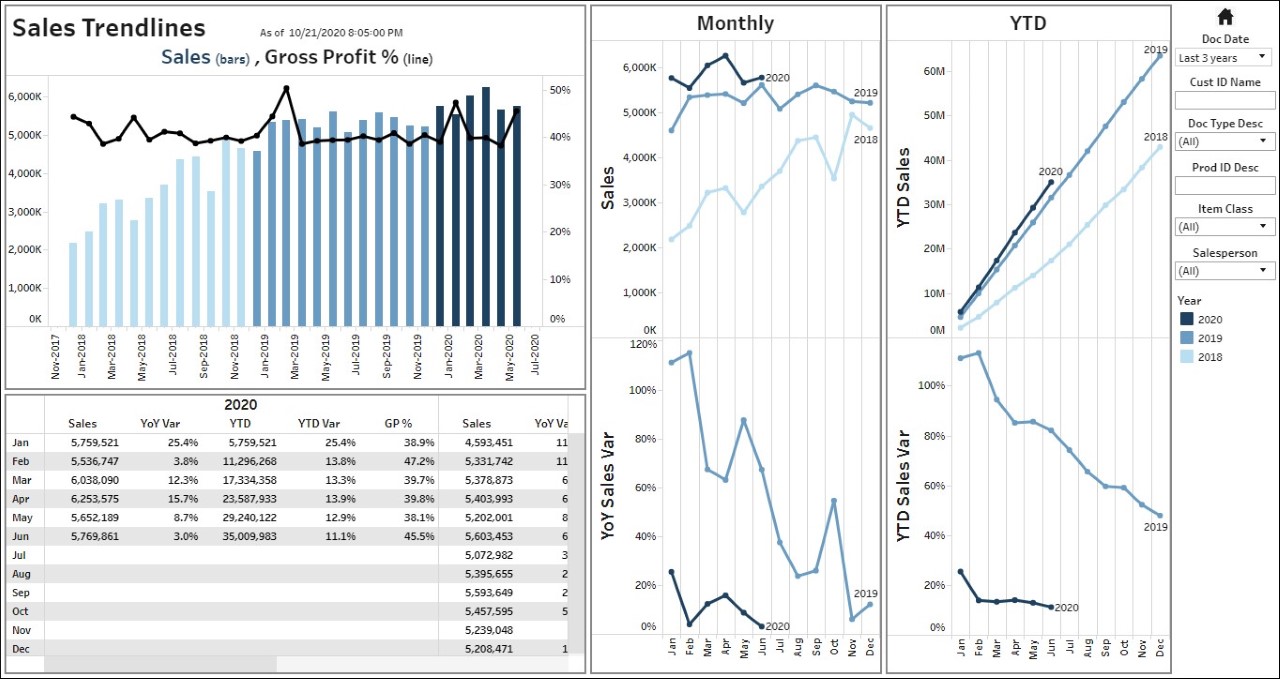
Sales Trendlines
Summarization of your sales trendlines.
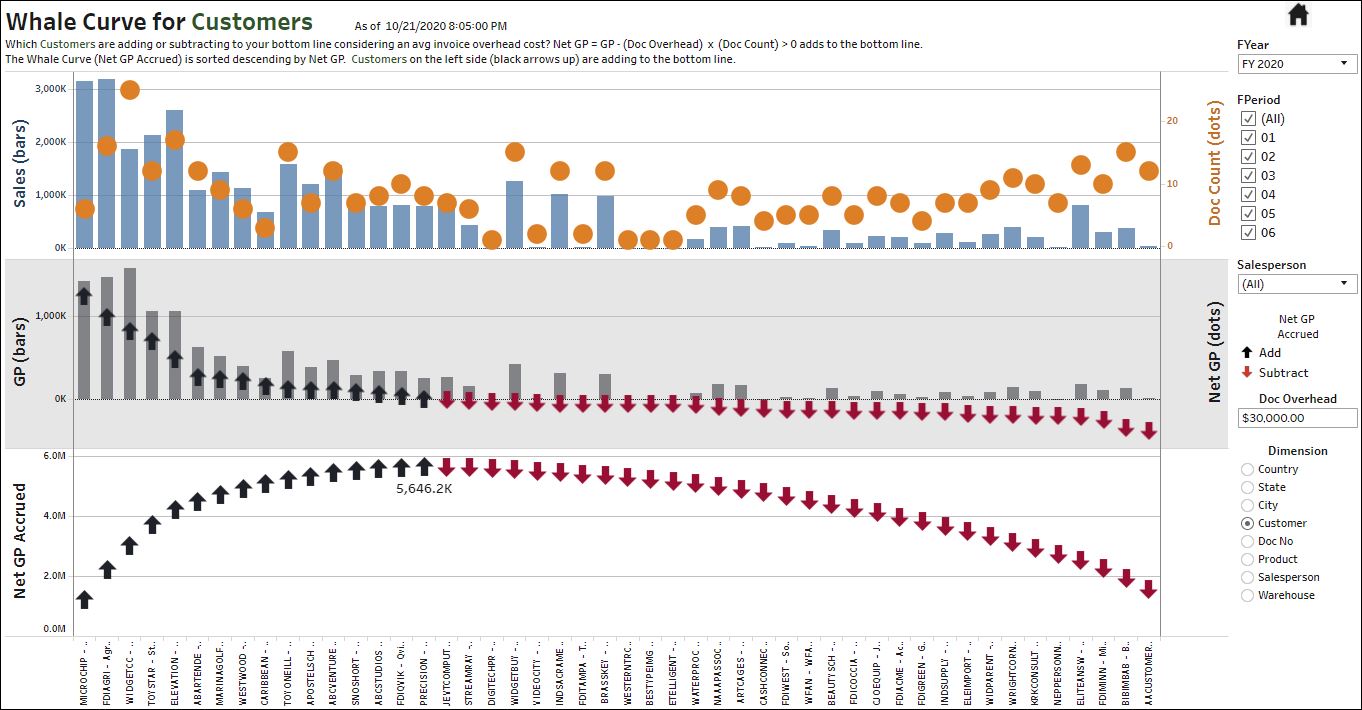
Whale Curve for Customers
Which dimensions (such as Customers) are adding or subtracting to your bottom line considering an avg invoice overhead cost? Net GP = GP – (Doc Overhead) x (Doc Count) > 0 adds to the bottom line. The Whale Curve (Net GP Accrued) is sorted descending by Net GP. Customers on the left side (black arrows up) are adding to the bottom line.
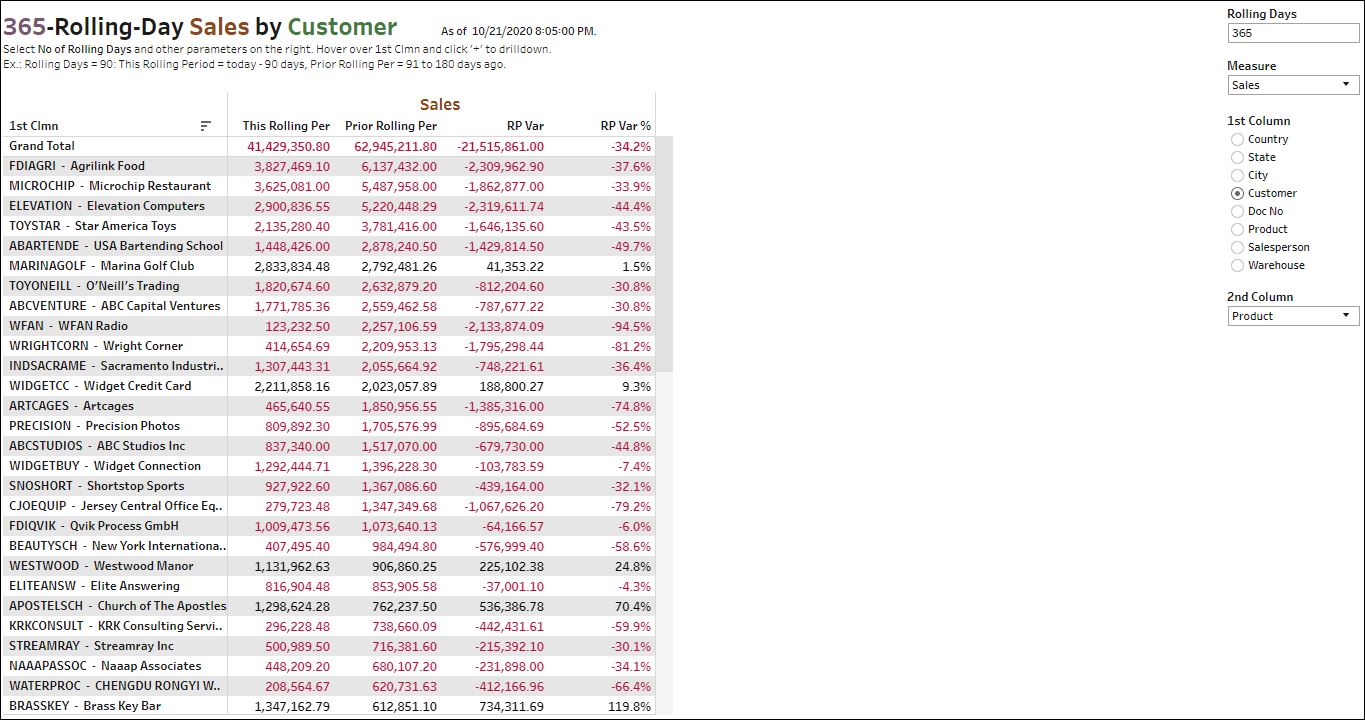
Rolling Sales / Moving Window Sales
Select No of Rolling Days and other parameters on the right. Hover over 1st Clmn and click ‘+’ to drilldown. Ex.: Rolling Days = 90: This Rolling Period = today – 90 days, Prior Rolling Per = 91 to 180 days ago.
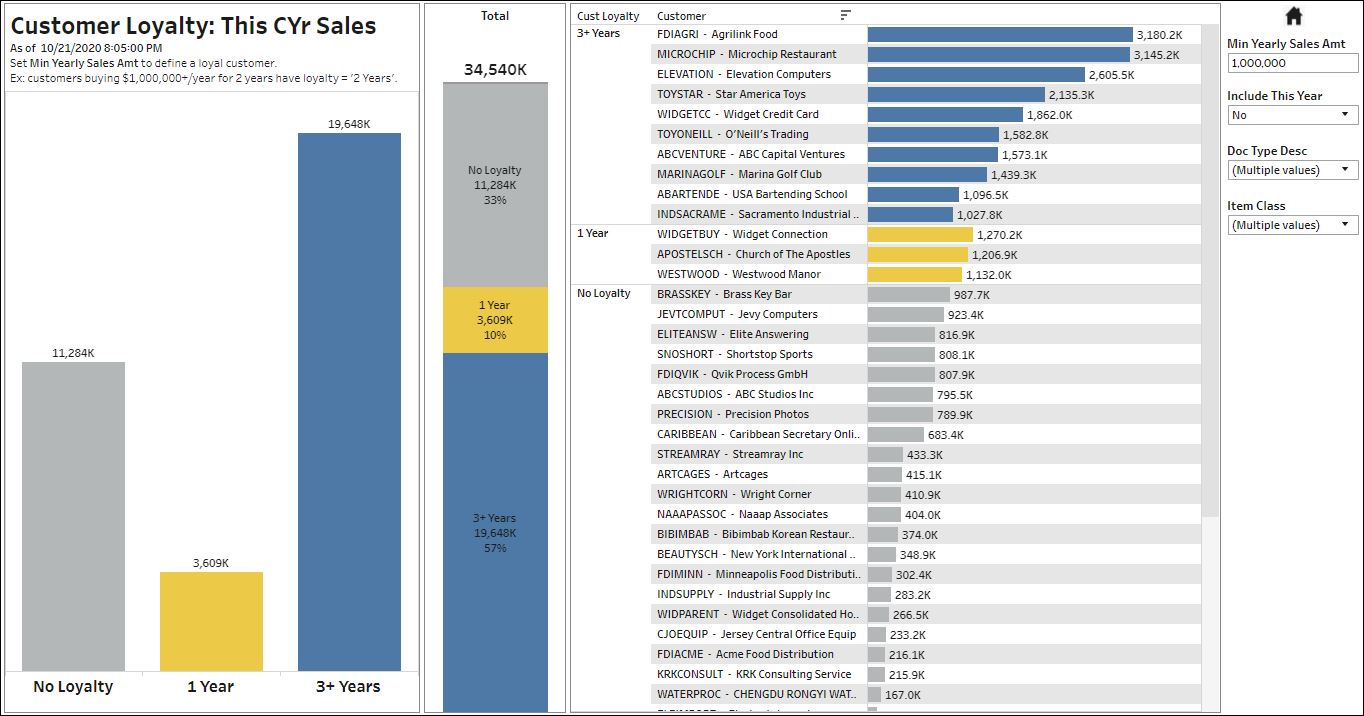
Customer Loyalty
Are you experiencing customer friction? Set Min Yearly Sales Amt to define a loyal customer.
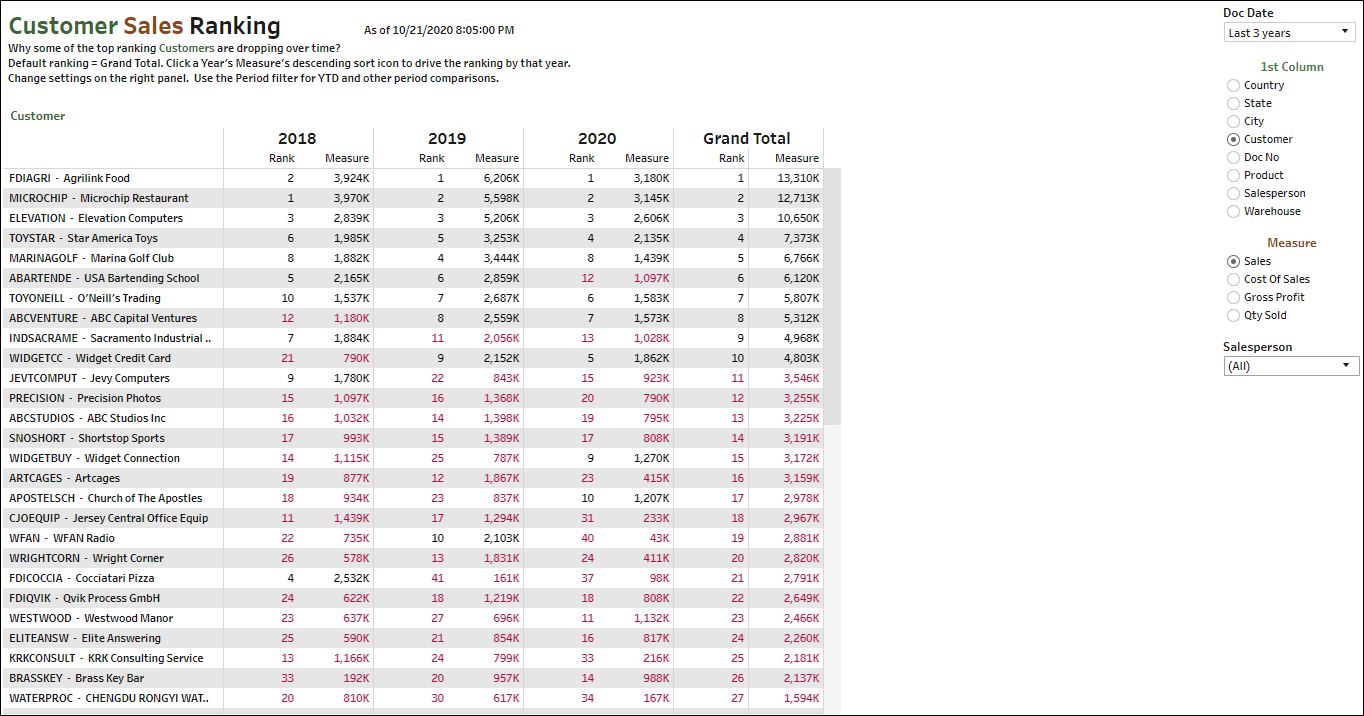
Customer Sales Ranking
Why some of the top ranking Customers are dropping over time? Default ranking = Grand Total. Click a Year’s Measure’s descending sort icon to drive the ranking by that year. Change settings on the right panel. Use the Period filter for YTD and other period comparisons.
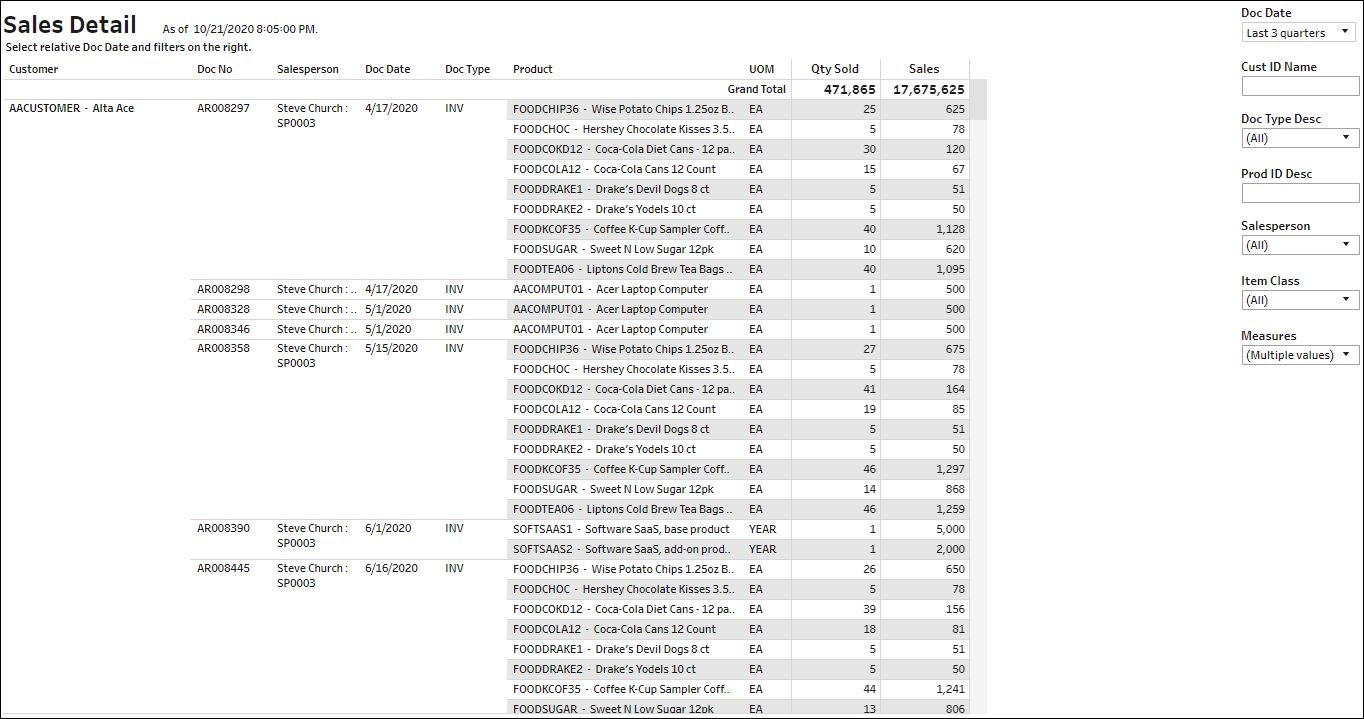
Sales Details
Select relative Doc Date and filters on the right.
Sales Projection
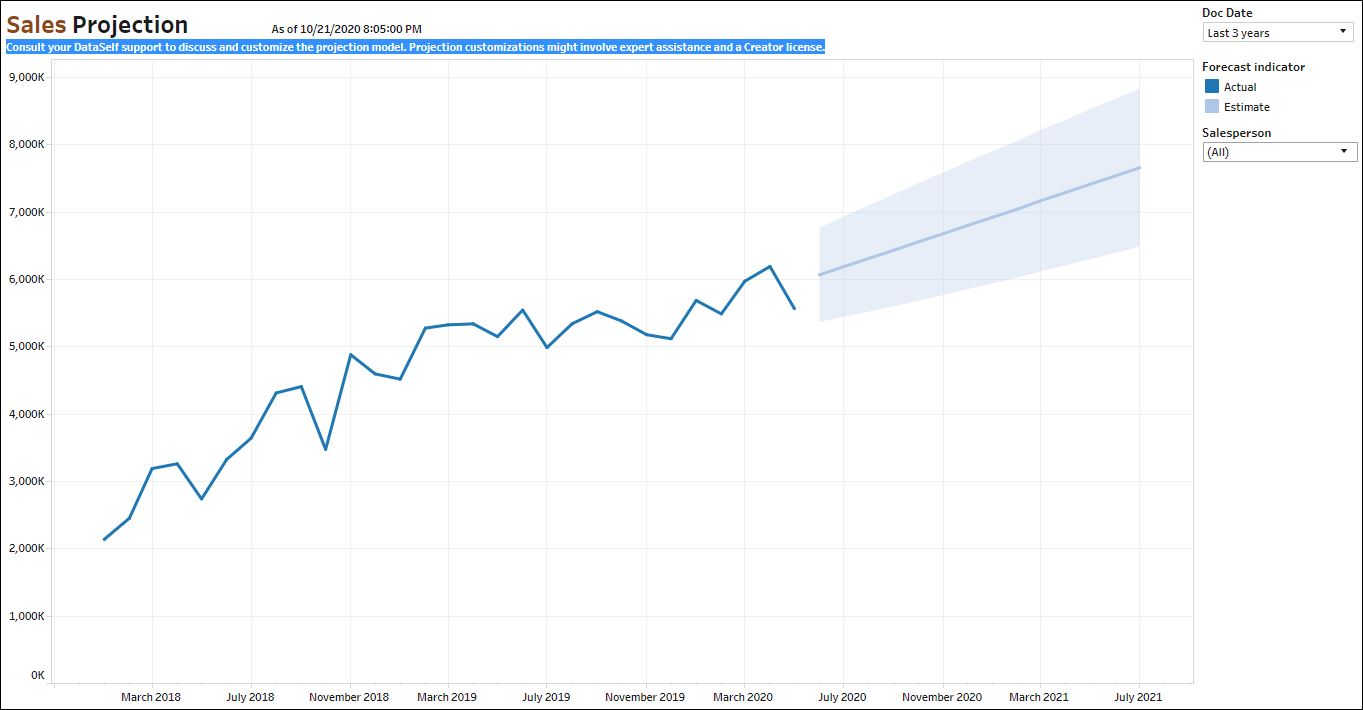
Consult your DataSelf support to discuss and customize the projection model. Projection customizations might involve expert assistance and a Desktop license.
