Inventory Planning
Prevent inventory shortages. Projecting future stocking based on known and projected stock movements.
>>> Click Here to see the sample workbook <<<.
Data Sources
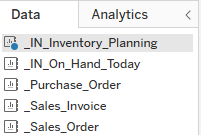
This is a list of the data sources used to calculate inventory projections.

Qty on Hand Detailed Projection | |
|---|---|
Qty OH Today | Shows in Today’s date column |
Qty On PO | by PO Exp date (Customize to include Mfg or other increase types) |
Qty On SO | by SO Exp Date (Customize to include Mfg or other issue types) |
Qty Proj Sales | Historical sales are pushed forward per customized spec's, then multiplied by the [Proj Sales Growth] parameter for the Projected Sales |
Proj Outbound | Greater of [Qty On SO] or [Qty Proj Sales] |
Proj Net Change | [Qty OH Today] + [Qty On PO] - [Proj Outbound] |
Proj Qty OH | RUNNING_SUM of [Proj Net Change]  |
Safety Stock | safety stock or Min OH from ERP. Same number in all date columns. |
Proj Excess/Short | [Proj Qty OH]-[Safety Stock] Table calculation  |
Proj Excess/Short Filter (color filter) | if [Proj Excess/Short]>=0 then 'Excess' else 'Short' END |
Demand (first column) | Per Item, for the total [Qty Proj Sales] within the selected [Exp Dates] range: Tech note: [Exp Dates] is a Context filter, which limits the LOD to the selected dates. |
Qty on Hand Projection | Summary of Qty on Hand Detailed Projection |
|---|
Days of Stock | |
|---|---|
Days of Stock | if sum([Qty OH Today]) <= 0 and sum([Qty Proj Sales])>0 then -9999999 |
Other reports | are from the regular Sales_Invoice, Sales_Order, Purchase_Order, IN_On_Hand_Today data sources |
|---|
Common Customizations
Reporting date ranges (weeks? months? days? etc)
Report how far into the future?
How far back to pull the Sales history, how far forward to push it
What about late PO’s and SO’s? Lump them all into Today, along with [Qty OH Today]? Push them a certain number of days into the future? Continue to exclude them, but add highlight the late ones in another tab?
Related Pages
Keys: IN_On_Hand_History, Inventory Planning Workbook
