
_Field_Service
This page describes DataSelf Enterprise’s customizable Power BI Templates for Field Service.
KPI: A Key Performance Indicator. KPIs can encompass a variety of data measurements to offer deeper insight into a specific area of your business. The following are examples of a KPI:
- A Report such as "Yearly Revenue";
- A Dashboard widget such as the main chart from the Cash Flow Projection dashboard;
- A Semantic Model measure such as Cost of Sales from the _SI_SalesInvoice Semantic Model;
- A Semantic Model dimension such as the Customer dimension from _AR_Aging_Today that provides the list of customers with open AR.
24 KPIs
Dashboards
A Power BI Dashboard contains one or more Power BI Worksheets and/or other objects such as webpages.
Dashboard Naming Convention:
-
“Power BI Workbook name (pbix file)”: “Power BI Dashboard name (view name)”
-
E.g., “- AP Aging: Vendor” dashboard can be found in the “Vendor” worksheet on the “- AP Aging.pbix” workbook. In Power BI Tenant, search for “- AP Aging”, then click the “Vendor” view.
Dashboard List (with screenshot examples)
– Appointment
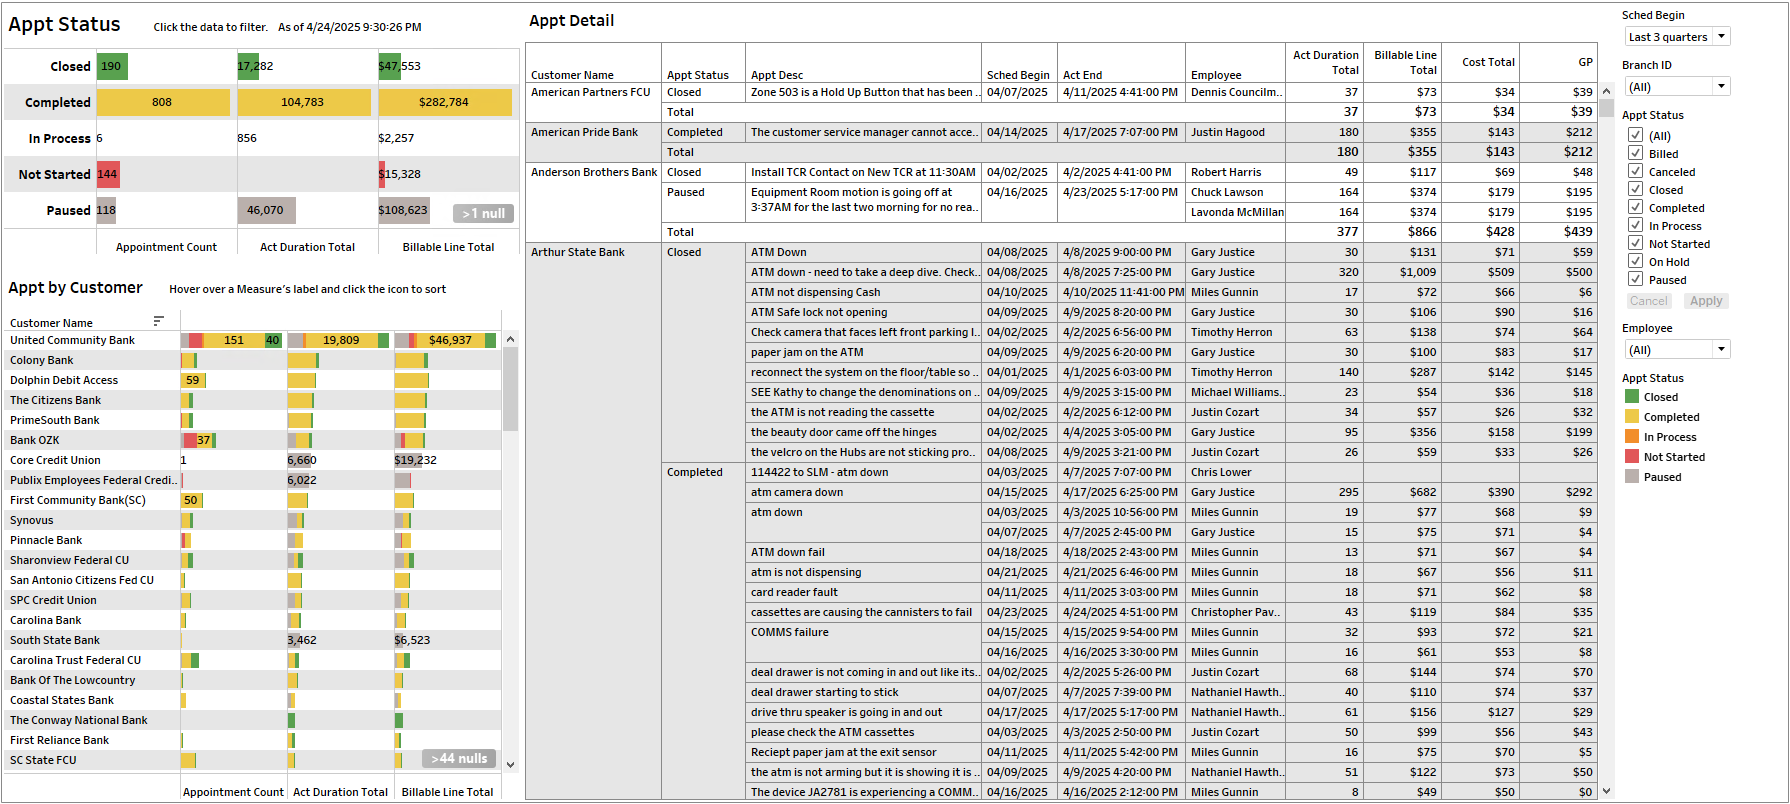
– Appointment Detail
– Appointment Status
- Service Order
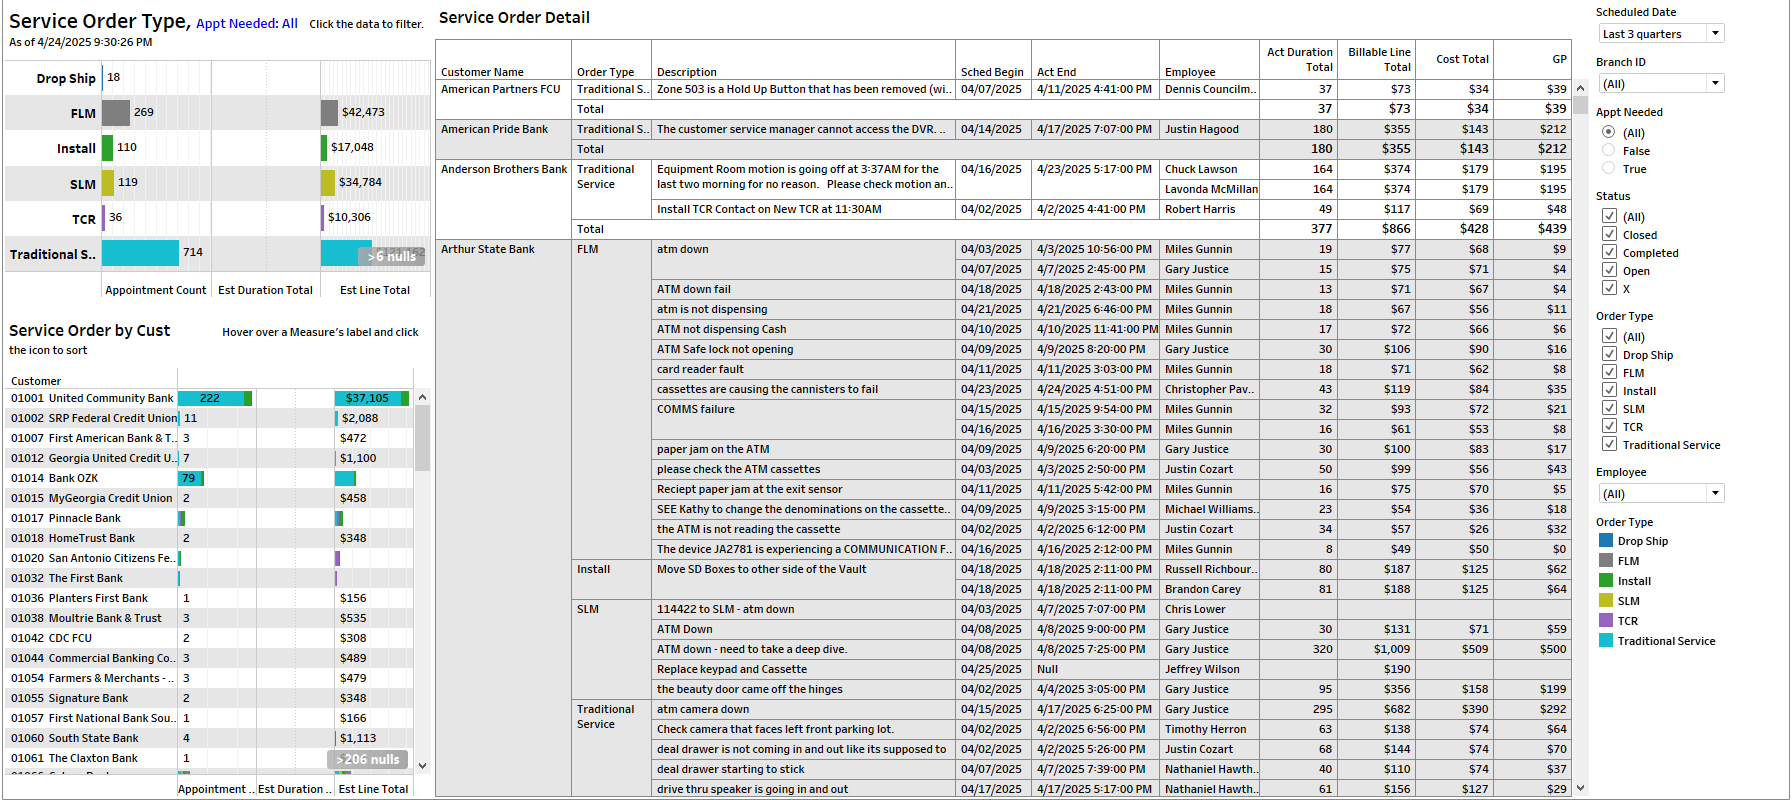
- Service Order Detail
- Service Order Detail by Type
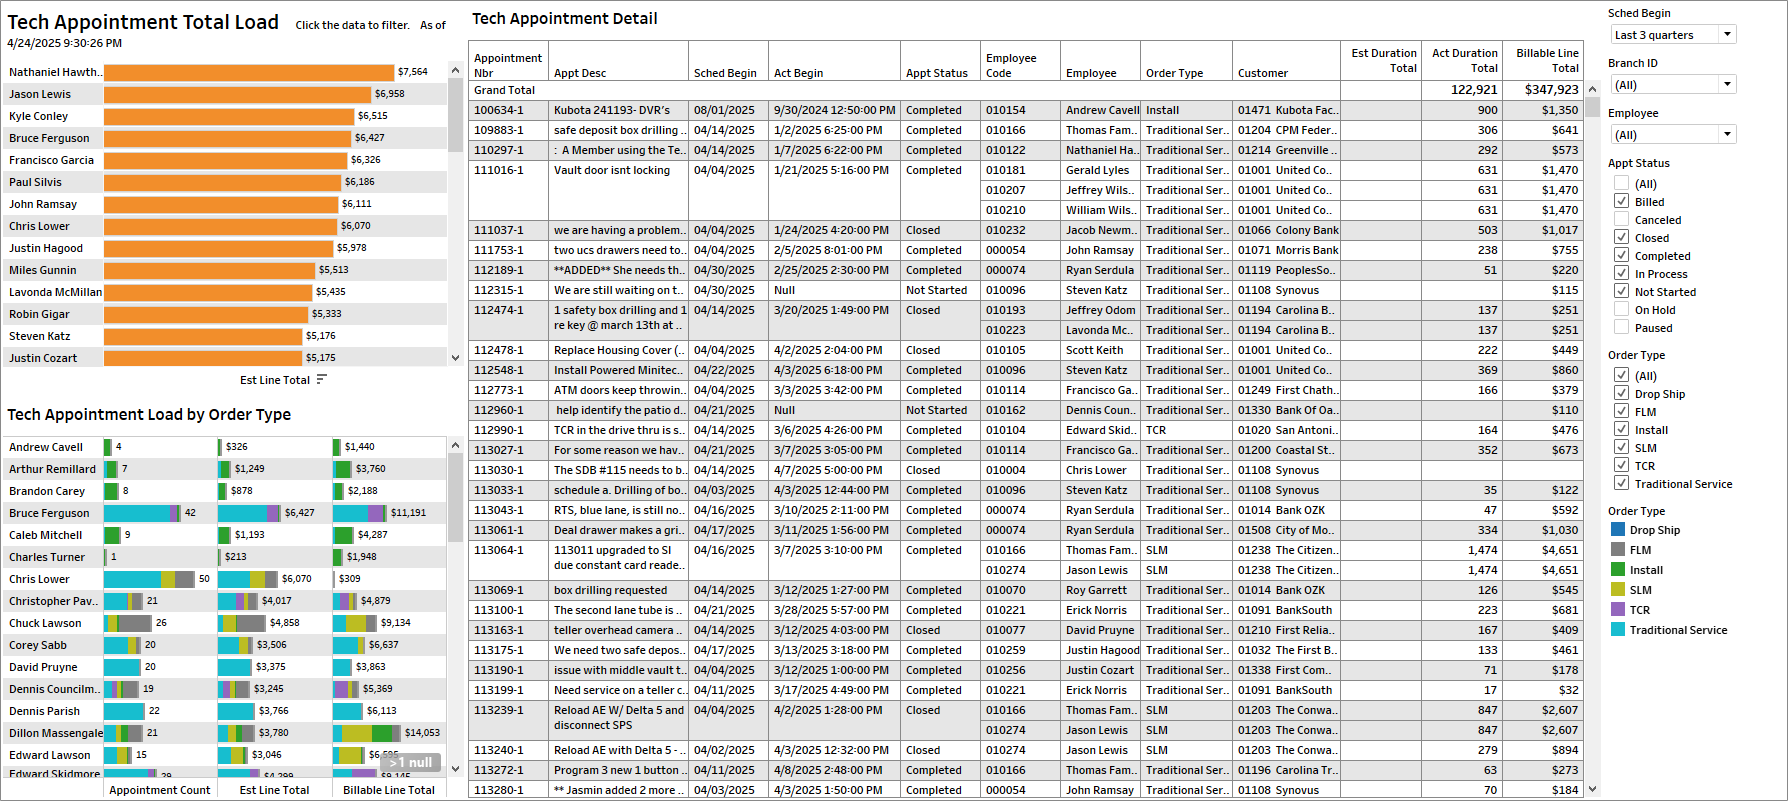
- Tech Appt Load
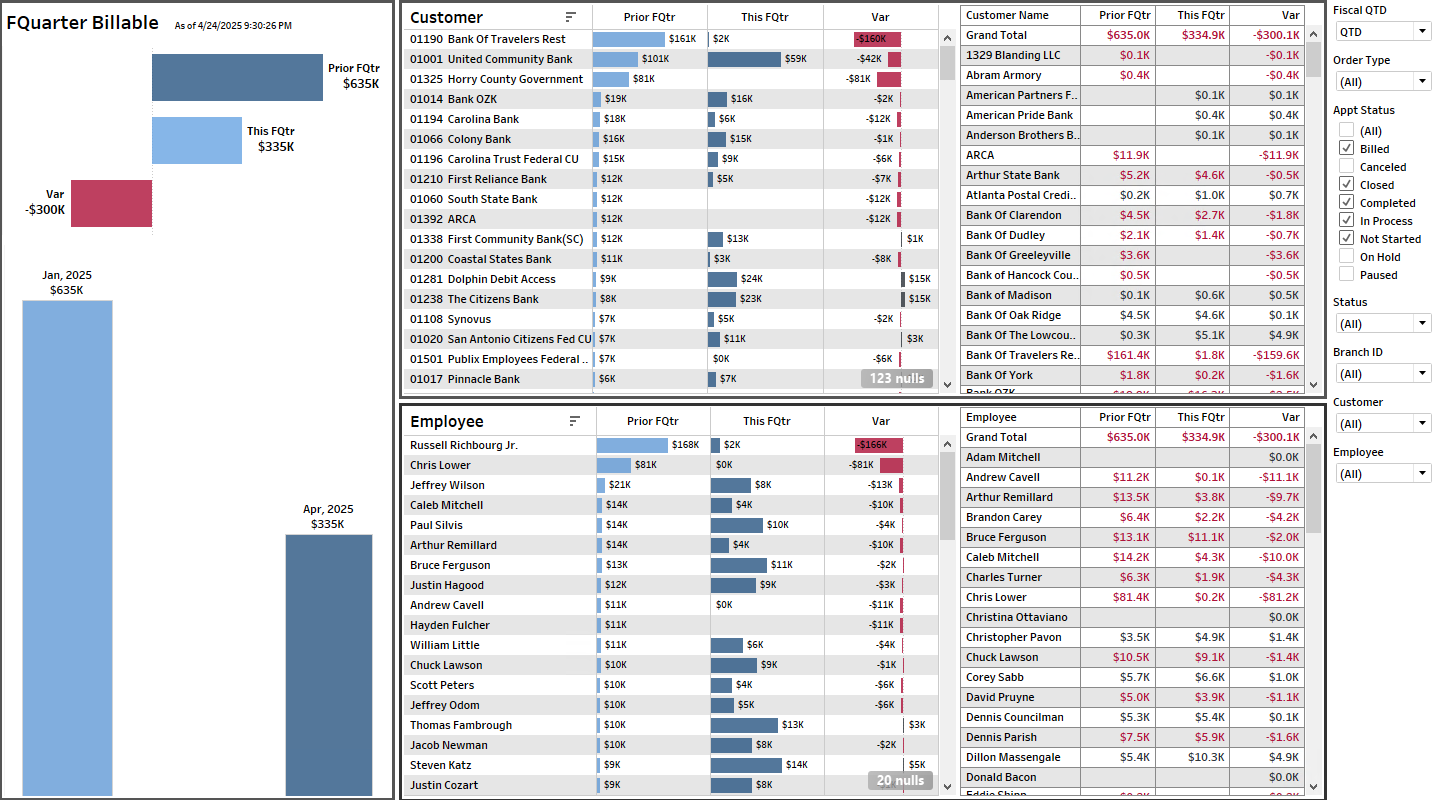
- FQuarter Billable
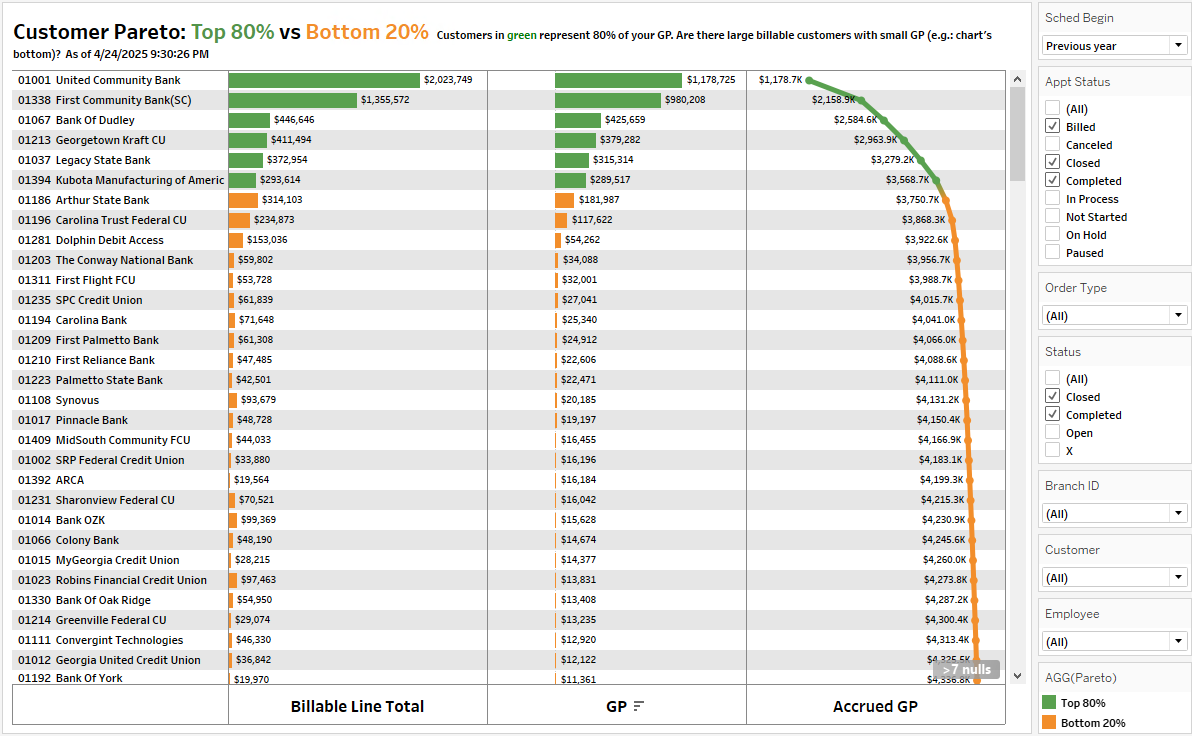
- Pareto
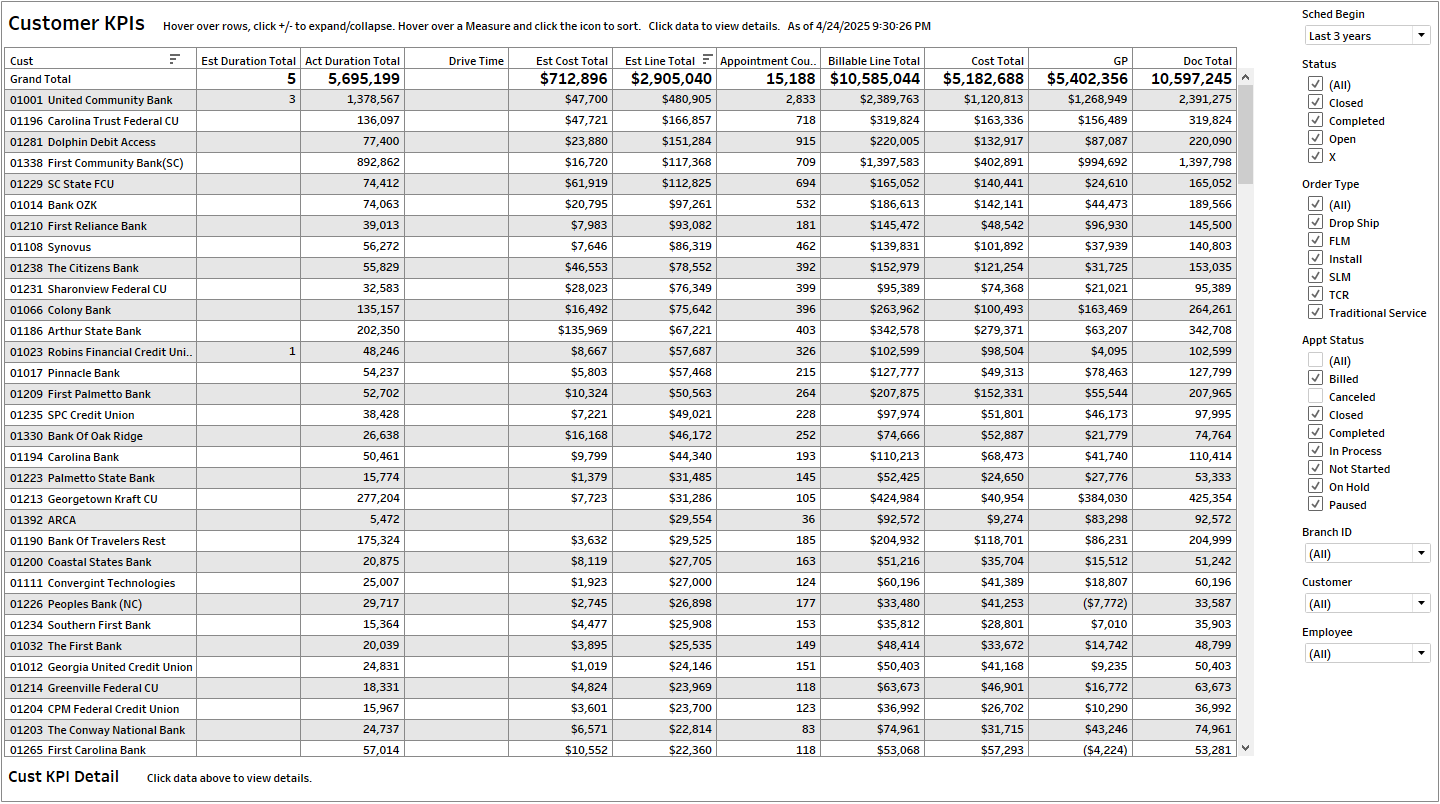
- Customer KPIs
Semantic Models
WIP.
Subject to change without notice. The actual templates can be slightly different than the documented ones.