
Work in Progress. Please contact us!
_Marketing_Email: Power BI Enterprise Templates
This page describes DataSelf Enterprise’s customizable Power BI Templates for Marketing Email.
KPI: A key performance indicator. Examples: a Report such as "Yearly Revenue"; a Dashboard widget (e.g., the main chart from the Cash Flow Projection dashboard); a Semantic Model measure (e.g., Cost of Sales from the _SI_SalesInvoice Semantic Model); a Semantic Model dimension (e.g., the Customer dimension from _AR_Aging_Today that provide the list of customers with open AR).
48 KPIs
Dashboards
A Power BI Dashboard contains one or more Power BI Worksheets and/or other objects such as webpages.
Dashboard Naming Convention:
-
“Power BI Workbook name (pbix file)”: “Power BI Dashboard name (view name)”
-
E.g., “Email Marketing: 1. Email Marketing” dashboard can be found in the “Email Marketing” worksheet on the “Email Marketing.pbix” workbook. In Power BI Tenant, search for “Email Marketing”, then click the “Email Marketing” view.
Dashboard List
-
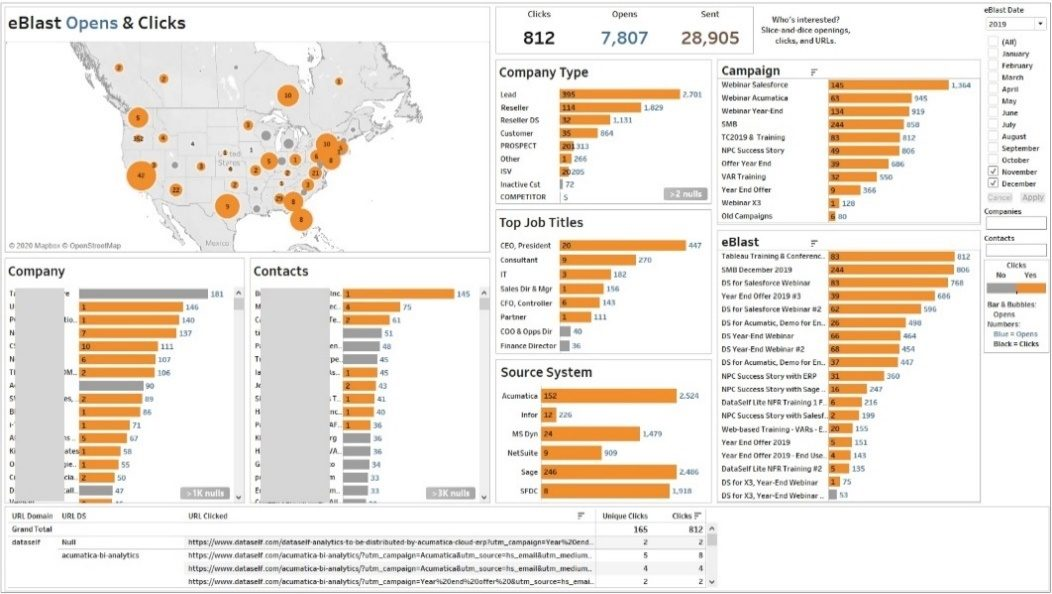
Email Marketing: 1. Email Marketing (8 KPIs)
-
Email Marketing: 2. Email Top Companies (6 KPIs)
-
Email Marketing: 3. Email Trends (3 KPIs)
-
Email Marketing: 4. Email KPIs (6 KPIs)
Reports
A Power BI Report is a Power BI Worksheet with a grid or chart.
Report Naming Convention:
-
Main report of a Workbook: “Power BI Workbook name (pbix file)”
-
E.g.: “Opens & Clicks: URL Clicked” report can be found in the “URL Clicked” worksheet on the “Opens & Clicks.pbix” workbook. In Power BI Tenant, search for “Opens & Clicks”, then click the “URL Clicked” view.
Report List
-
Opens & Clicks: Opens & Clicks by Contact (1 KPI)
-
Opens & Clicks: Opens & Clicks by eBlast Campaign (1 KPI)
-
Opens & Clicks: Opens & Clicks by Region (1 KPI)
-
Opens & Clicks: URL Clicked (1 KPI)
-
Top 10 Companies: Companies (1 KPI)
-
Top 10 Companies: Contacts (1 KPI)
-
Top 10 Companies: eBlast Campaign (1 KPI)
-
Top 10 Companies: URL Clicked (1 KPI)
Semantic Models
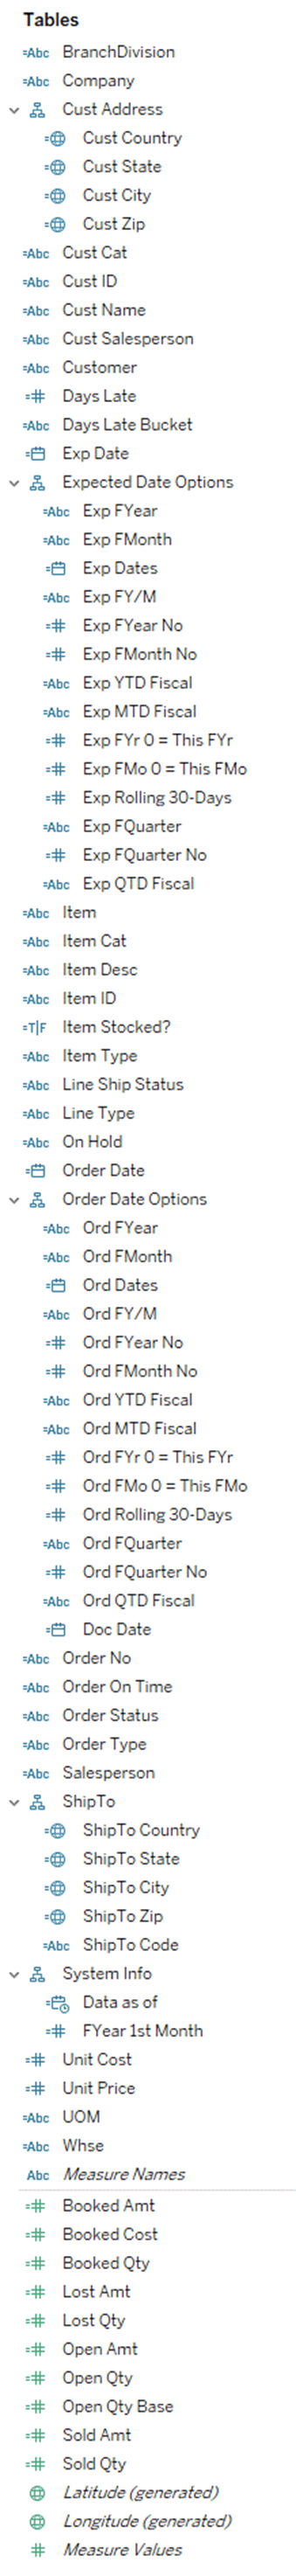
Semantic Models allow users to easily and quickly do ad hoc analysis and customize reports, dashboards, and stories. This properly deployed Semantic Model will contain data from your CRM system (e.g., Customer Relationship Management and/or Excel/CSV files) refreshed on a schedule (e.g., every night, hour, or minute).
A Power BI Semantic Model contains data and a data model that prepares your raw data for powerful reporting. Semantic Models include dimensions, hierarchies, measures, and parameters that can be used in reporting. Semantic Models' data come from source systems' tables (e.g., Item table from your ERP) and are modeled via Power BI Desktop.
Subject to change without notice. The actual templates can be slightly different than the documented ones.