
This dashboard provides extensive ways to analyze critical YoY trends from sales transactions (invoiced sales). This dashboard is present in the following workbooks:
-
DataSelf 360-View: Provides owners and C-Level people with YoY sales trends by branch, salesperson, geo location, customer and product.
-
DataSelf for Sales: Provides salespeople with YoY sales trends by geo location, customer and product.
Dashboard Sections
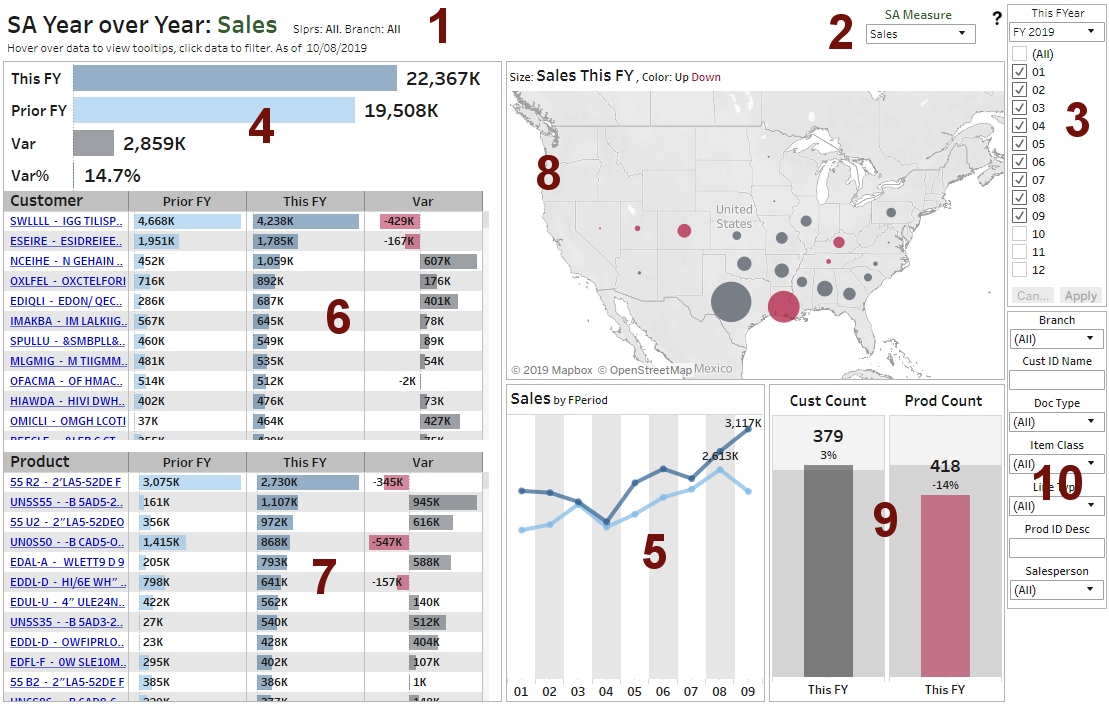
The screenshot below is from the DataSelf for Sales workbook, but the functions and widgets are similar to the 360-View dashboard. The large red numbers are explained below.
-
The dashboard title has the following values:
-
Main measure being displayed (Sales shown). Use the SA Measure dropdown list (area # 2) to change the main measure to another measure.
-
Salesperson and Branch filters applied (using filters from area # 10).
-
Data refreshed as of date/time stamp.
-
-
SA Measure dropdown controls the main measure displayed in the dashboard (also prominently listed on area # 1).
-
This FYear and Period control how This FY and Prior FY measures are calculated. For instance, from the screenshot, This FY = all sales for FY 2019 from FP 01 through 09, while Prior FY means all sales for FY 2018, FP 01 through 09.
-
Totals and color legend:
-
Totals for This FY, Prior FY, and variances.
-
Color legend (for the whole dashboard): Dark blue = SA Measure This FY, light blue = SA Measure Prior FY. Variances: black = growth, red = decline.
-
-
YoY trend analysis by period.
-
Prior FY, This FY and Var by customer.
-
Prior FY, This FY and Var by product.
-
This FYear and growth by geo location. The size of the bubbles relate to the SA Measure (Sales shown), while the color shows the variance from Prior FY.
-
Removed in v2.0:
Section showing Customer and Product Counts and variances. The dark gray background = count for Prior FY, bar = count for This FY, and the bar's color = growth or decline. -
Use the filters to narrow down the YoY analysis.
Filtering, Sorting, and Slicing and Dicing
-
Filtering: Use filters from areas #3 and 10 to narrow down the analysis. Empty boxes such as for Cust ID Name work as contains filters. Ex.: type in aa, press enter, and the dashboard will only show customers with letters aa in their ID and/or name.
-
Sorting: Hover the mouse over a column header (such as Var in the Customer widget), a sort icon will appear on the far right, click it once to sort descending, click again for ascending, click again to reset the sort order to alphabetical. For instance, to view the top products by sales decline since prior year, hover the mouse over the Var column on the Product widget, click the sort icon twice.
-
Pop ups: Hovering the mouse over data points can reveal more information. For instance, hover the mouse over a map bubble or the Cust Count bar to see the pop up info.
-
Clicking on a single or multiple data points on any of the widgets to filter the other panels accordingly. Regular keyboard and mouse standards apply (such as press and hold the Ctrl or Shift buttons to select multiple data points). Click here xxxxx to learn how to select data points on maps. For instance, click on a customer, or a few customers and the other panels will be filtered for data associated to the selected customers.
-
Upon selecting data points, explore the options from the pop up window: Keep Only, Exclude and View Data.
-
Undo/Redo (top or bottom left).
-
Revert (top or bottom left) will bring the default back to its pre-saved settings.
-
Full Screen (top or bottom right).
-
Download (top or bottom right).
-
Set this as your DataSelf landing page: Click the top right circle, click Make This My Start Page.
-
When accessing the dashboard from a DataSelf portal (not in embedded format): Click the Star icon on the top left to save it as a favorites. Click the Star icon on the top right to access list of favorites.
Saving Customizations
Make modifications to the dashboard (such as applying filters), click View: Original on the top or bottom right, fill out the form and click Save. Note that you can make one of your customized saved views as your default - meaning, it will open that customized View every time you visit this dashboard.
Commenting
To remember your customizations (ex.: why you filtered the dashboard) or exchanging messages with peers directly on the dashboard, click Comments on the top or bottom right. Tagging a person with @ will email them the comments.
Emailing on a Schedule
Click Subscribe on the top or bottom right and fill out the form. You can email customized views (see section above).
Embedding in other Web Applications
Section 4 of the link below applies to all software applications that accept either iFrame or Java script web widgets.
Embed Dashboards in Acumatica, iFrame, or Java script web widgets