Tableau OEM Shared Workbooks (e.g., Plant Floor Monitors)
Display reports and dashboards on large monitors.
Tableau Shared Workbooks
For displaying reports and dashboards on monitors located on plant floors, meeting rooms, etc.
Types of User Authentication
There are two ways to license shared workbooks with DataSelf based on user authentication:
Dedicated user license: This approach uses Tableau user authentication to secure the access to your reports and dashboards. It requires one Explorer/Viewer user license plus one or more Shared-Workbook license(s). User authentication options:
Standard: Once a user is logged on, by default, the session will be open (doesn’t require a log in again) for 12h since the last interaction. Refreshing pages frequently will keep the session open indefinitely.
Single Sign-On: Sync up your SAML-based Active Directory (such as from Azure) with our Tableau server to avoid user sign in.
Trusted Authentication: https://help.tableau.com/current/server/en-us/trusted_auth_testing.htm
Lear about more options at: Tableau Authentication Options (Sign In)
Tableau guest account: This approach creates an URL to your shared workbook that is openly available in the internet (it doesn’t require user credentials). It only requires one or more Shared-Workbook license(s). Anyone who knows the exact URL can view the reports and dashboards on the internet.
Instructions for Tableau Guest Account for the tds, workbook, and view to work without signing in:
Change permissions on tds to allow All Users (and Guest) to View
Change permissions on workbook to allow All Users (and Guest) to View
Change permissions on view to allow All Users (and Guest) to View
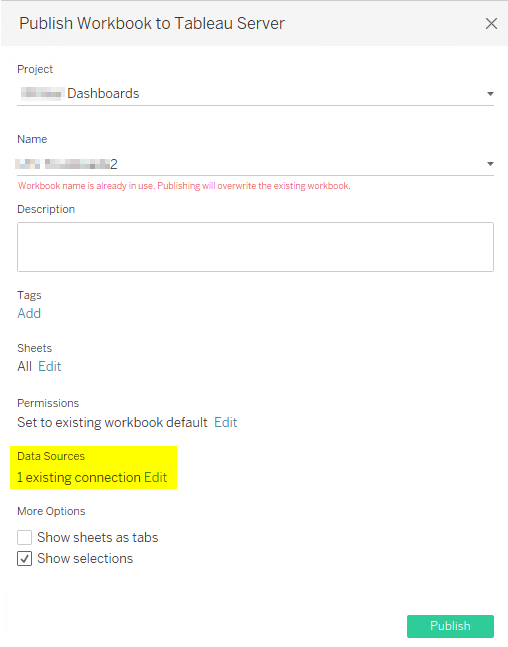
When publishing the workbook through Tableau Desktop, set the Authentication to “Embed password”
Test the URL in Incognito mode to ensure it does not require you to sign in.
Publishing Shared Workbook on Monitors
If you don’t have a Shared Workbook license in DataSelf contract, please contact your DataSelf seller.
It’s best practice to create a specific Tableau data source(s) and workbook(s) for this use case.
Set up an ETL+ and Tableau data source refresh process for the desired frequency (ex.: every hour).
Create a dedicated workbook for sharing your reports and dashboards.
Using a dedicated user license: Use Tableau Server or embedded data sources in your workbook.
Using Tableau guest account: Embed the data source in the workbook.
Learn about published vs embedded data source: https://help.tableau.com/current/pro/desktop/en-us/publish_datasources_about.htm
Incorporating the reports/dashboard in Chrome web browser to display on your plant floor monitors (it’s also possible to replicate these steps with other web browsers such as FireFox):
Test that the report(s) is working correctly on your DataSelf Tableau Web portal using Chrome.
To remove Tableau headers (more data real estate), add at the end of the Tableau URL in Chrome:
Remove :idd=[#]
Add :refresh&:embed=y
Ex: Original Tableau URL:
https://www.dataselfbi.com/t/abc/views/MFG/KPI?:iid=2
URL adjusted:
https://www.dataselfbi.com/t/abc/views/MFG/KPI?:refresh&:embed=y
You can use URL parameters to filter the report. For instance, a single view (URL) can show ShipTo=CA or FL or a combo of states. Click here to learn more: https://help.tableau.com/current/pro/desktop/en-us/embed_structure.htm .
Examples (first two for data for one State, the third filters data for CA & FL combined):
https://www.dataselfbi.com/t/abc/views/MFG/KPI?State=CA&:refresh&:embed=y
https://www.dataselfbi.com/t/abc/views/MFG/KPI?State=FL&:refresh&:embed=y
https://www.dataselfbi.com/t/abc/views/MFG/KPI?State=CA,FL&:refresh&:embed=y
Test the adjusted URLs on your big monitor.
Here are some Chrome extensions to automate the auto refresh of the URL(s) on your monitor(s):


