
Link direct to the workbook view: DataSelf Analytics v2201: YoY - DataSelf Analytics
|
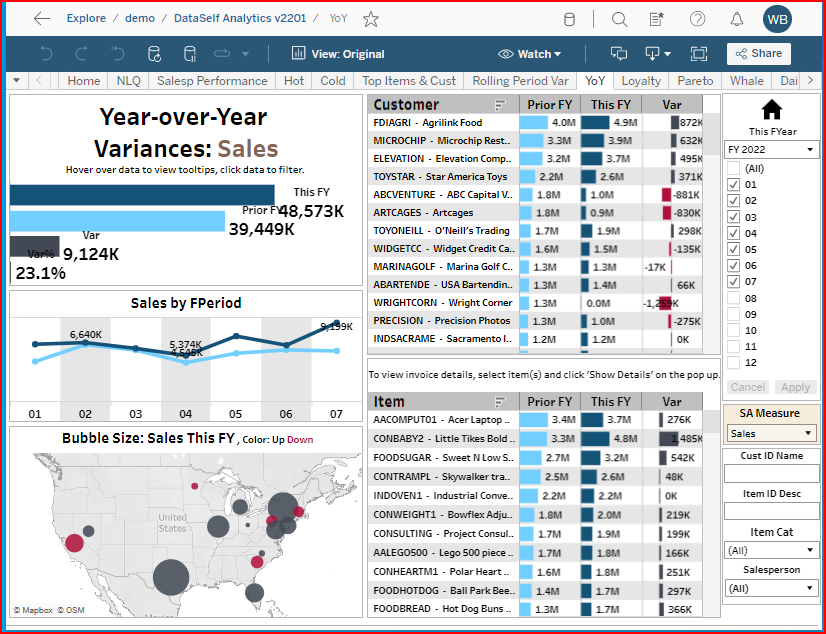
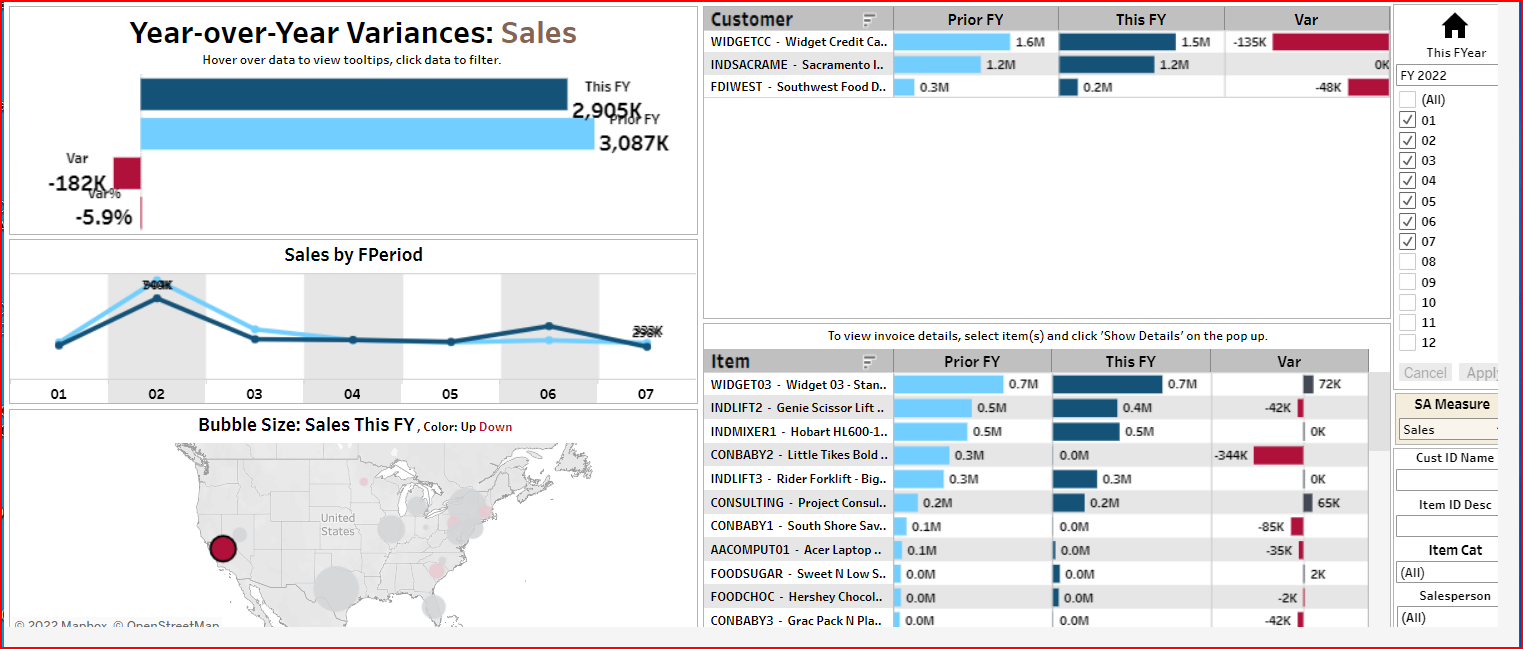
The YoY Variances is the most popular OOTB view among our customers.
|
|
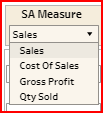
Selecting records using dimension filters
In the example below the Cust ID Name field has “ABC” entered, so it displays only those customers with ABC in either the ID or Name fields. The items and Year-over-Year sales info also show only the sales for the selected customers. The dashboard is interactive.
ABC
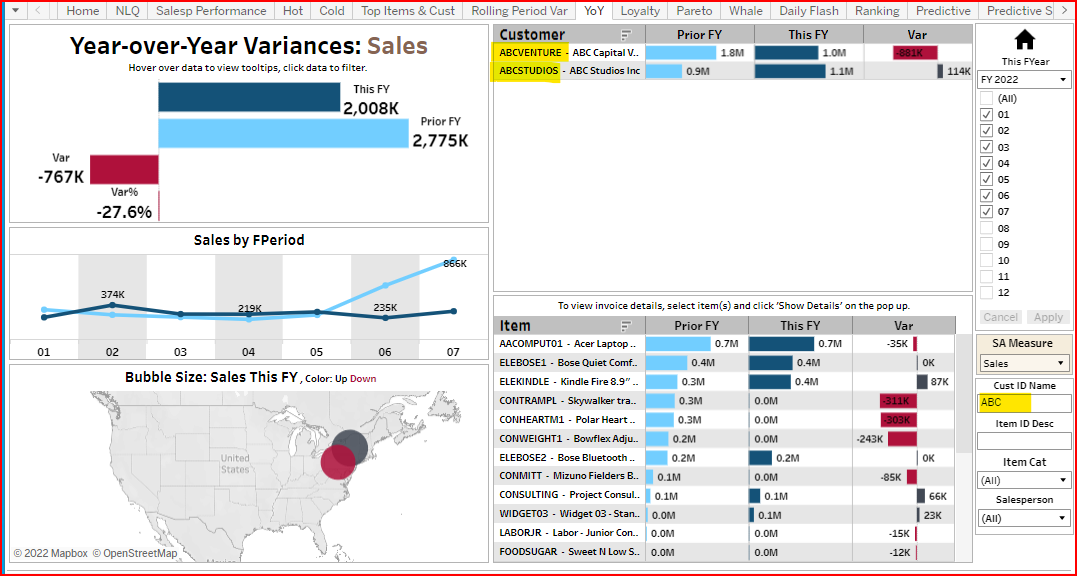
Selecting records using Highlighting to show related data.
Below is an example of highlighting records to show related data.
The customer MICROCHIP is highlighted, so only the items and sales related to the highlighted customer display. To select multiple rows, use Shift-Click or Control-Click.
Selecting records on the map
To see customers & items in a specific geography, click on the map bubble to highlight and select only related data. In the example below the bubble in CA was highlighted, selecting only those customers and items sold in that geographical area.
You can highlight multiple records with Ctrl-Click, Shift-Click, or hold down the mouse button while dragging across multiple areas to highlight them. To un-highlight records, click on the highlights until none show.
You can save your selection settings as a Custom View so you don’t have to re-set your selections every time you open the workbook.