
Overview
DFT+ (Dimension, Fact, Time) modeling decouples the quirks of transactional sources from the analytics layer.
The aim is to keep reporting, analytics, and AI models stable as the company upgrades, replaces, or outgrows OLTP systems — for example, during ERP migrations or when consolidating multiple ERPs or payroll systems.
Within DFT+, a SPOT (Single Point of Truth) defines the authoritative dataset for each critical business concept. Each SPOT is implemented as a data-warehouse table or view and uses SQL to produce clean, clearly named columns — primary keys, foreign keys, and analysis attributes — so downstream content doesn’t break when sources change.
Example — Customer SPOT: it contains all attributes for customer dimension analysis. Some fields might come from the ERP (Customer ID, Name, Address), while enrichment can come from CRM (e.g., Lead Source), spreadsheets, or other systems. The Customer SPOT can also harmonize and deduplicate customers across sources, enabling consistent reporting through consolidations and migrations.
DFT+ Stages
Stage 1 — Source Mirroring: Creates a clean, fast, low-impact copy of raw source data, preserving lineage and keys.
Stage 2 — Data Warehouse: Builds the primary SPOTs (dimensions/facts) via SQL (or Python), applying cleansing and conformance, and defining clear columns plus surrogate/foreign keys..
Stage 3 — Analytics: Leverages analytics engines modeling (e.g., Domo, Looker, Power BI, Tableau), optimizing joins and aggregations where those tools perform best.
Stage 4 — Report, Dashboard, and KPI Templates: This is an extensive and customizable library of reports, dashboards, and KPIs that plug-and-play on Stage 3.
Stage 1 - Source Mirroring
DataSelf ETL+ is a powerful, easy-to-use tool for source mirroring.
You can design this Stage from scratch (click the following list of ETL+ 430+ No-code Data Sources), or accelerate optimized mirroring with our pre-mapped ETL+ Pre-mapped Source Systems.
Stage 2 - Data Warehouse
Stage 2 is housed in a SQL data warehouse (usually SQL tables/views). It transforms ERP-specific structures into the standardized model used by reports and dashboards (as in DataSelf Stages 3–4 templates).
Changing Stage 2 logic automatically propagates to all downstream reports and dashboards. For example, changing the Gross Profit calculation to absorb freight in Stage 2 will automatically show Gross Profit with freight absorbed in all downstream reports, dashboards, and AI models.
|
Table Name |
|
|---|---|
|
_D_Account |
CA, CO, CM, CT |
|
_D_Acct_Address |
CA, CO, CM, CT |
|
_D_Appointment |
FS |
|
_D_Branch |
All |
|
_D_Company |
All |
|
_D_CustAddress |
AR,CA,EO, ER,ES,ET,PM,SI,SO |
|
_D_Customer |
AR,CA,CF,IP,EO,ER,ES,ET,PM,SI,SO |
|
_D_CustomField |
TBD |
|
_D_Employee |
PY |
|
_D_Equipment |
FS |
|
_D_GL_Acct |
AR, GF, GT, SI, SO |
|
_D_GL_SubAcct |
AR, GF, GT, SI, SO |
|
_D_Item |
EO, ER,ES,ET,IO, IH, IP, IT, PO, SI, SO |
|
_D_Lead |
CA, CM, CO, CT |
|
_D_Location |
IO, IH, IP, IT, PO, SI, SO |
|
_D_Marketing_Email |
CM |
|
_D_Opportunity |
CO |
|
_D_Project |
PM |
|
_D_Salesperson |
AR, CA, PM, SI, SO |
|
_D_ShipTo |
EO,ER,ES,IO, IH, IP, IT, PO, SI, SO |
|
_D_Technician |
FS |
|
_D_Territory |
CA,CO,CM,CT,EO,ER,ES |
|
_D_Ticket |
CT |
|
_D_Vendor |
AP, IT, PO |
|
_D_Warehouse |
IO, IH, IP, IT, PO, SI, SO |
|
_F_AP_Aging_Today |
AP |
|
_F_AR_Aging_Today |
AR |
|
_F_Cash_Flow_Projection |
CF |
|
_F_CRM_Contact_Activity |
CA |
|
_F_CRM_Marketing_Email |
CM |
|
_F_CRM_Opportunity |
CO |
|
_F_CRM_Ticket |
CT |
|
_F_EO_Order |
EO |
|
_F_ER_Returns |
ER |
|
_F_ES_ShoppingCart |
ES |
|
_F_ET_Traffic |
ET |
|
_F_Field_Service |
FS |
|
_F_GL_Financials |
GF |
|
_F_GL_Transaction |
GT |
|
_F_GoogleAnalytics |
GA |
|
_F_IN_Inventory_Planning |
IP |
|
_F_IN_On_Hand_Today |
IO |
|
_F_IN_On_Hand_History |
IH |
|
_F_IN_Transaction |
IT |
|
_F_MFG_BOM |
MB |
|
_F_MFG_Production_Order |
MW |
|
_F_Payroll |
PY |
|
_F_Project_Management |
PM |
|
_F_Purchase_Order |
PO |
|
_F_Sales_Invoice |
SI |
|
_F_Sales_Order |
SO |
|
_T_DataAsOf |
All |
|
_T_Date |
All |
|
_T_Period |
GF, GT, IH |
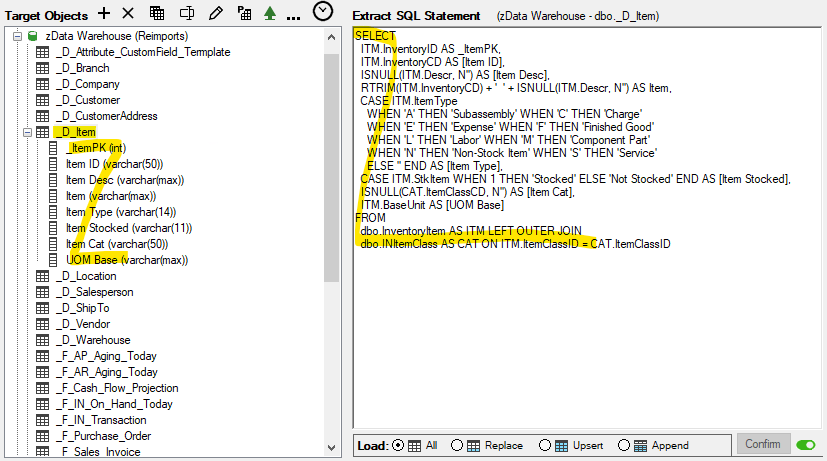
Stage 2 DFT+ - A SQL Statement Example
Example from ETL+ transformation: mapping ERP tables to the target _D_Item DFT+ table.
Stage 3 - Analytics
Stage 3 Analytics turns Stage 2 data into fast, ready-to-use datasets. Depending on the use case, this stage is implemented in the data warehouse and/or in tools such as Power BI, Tableau, Excel, and AI tools (such as Claude and ChatGPT).
DFT+ Star Schemas
Key benefits of a well-designed Star Schema include simplicity, flexibility, high performance, and a single version of the truth. It organizes data around a single fact table connected directly to its related dimension tables, making reports and data analysis easier to build, understand, maintain, and optimize for performance.
A star schema focuses on a single business process, such as Sales, Purchasing, Inventory, or General Ledger. Each dimension is directly related to the central fact table, creating a simple, intuitive structure that is ideal for most dashboards and reports.
Star schemas are easier to maintain, deliver excellent query performance, and provide a solid foundation for self-service analytics. As reporting requirements expand to span multiple business processes, multiple star schemas can be combined into a galaxy schema by sharing common dimensions.
Simplified Example
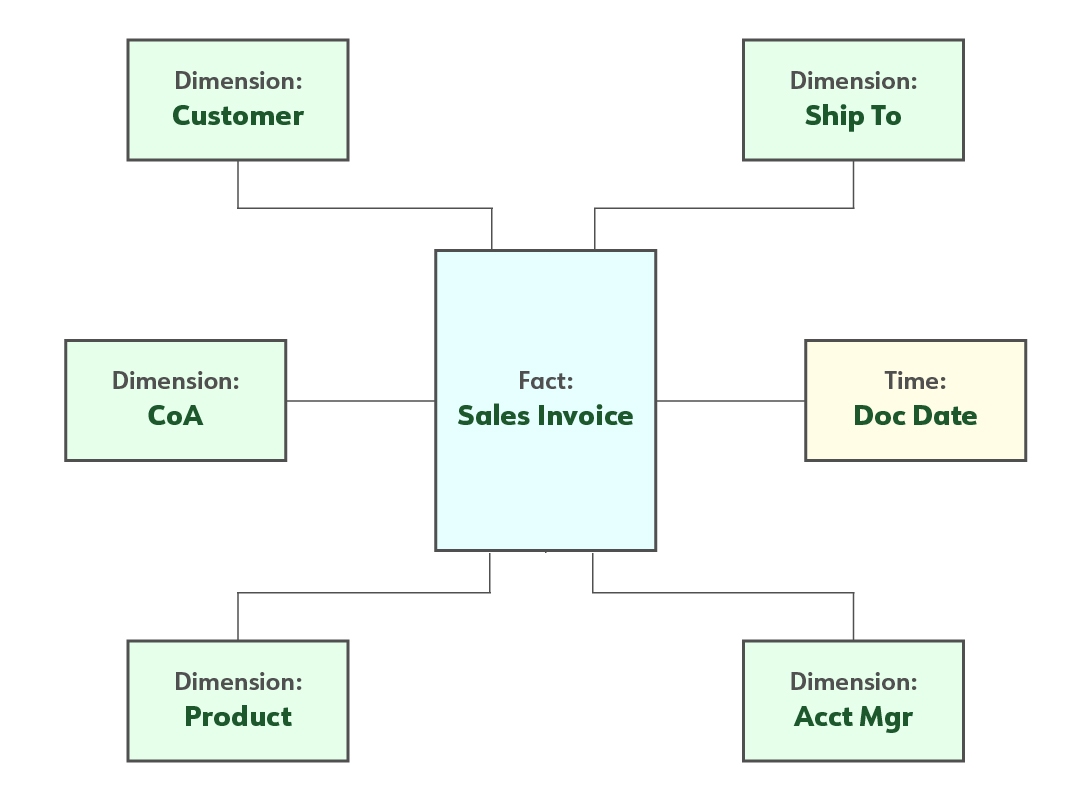
This example illustrates a single fact table surrounded by its related dimension tables, such as Customer, Product, Salesperson, Time, and Geography.
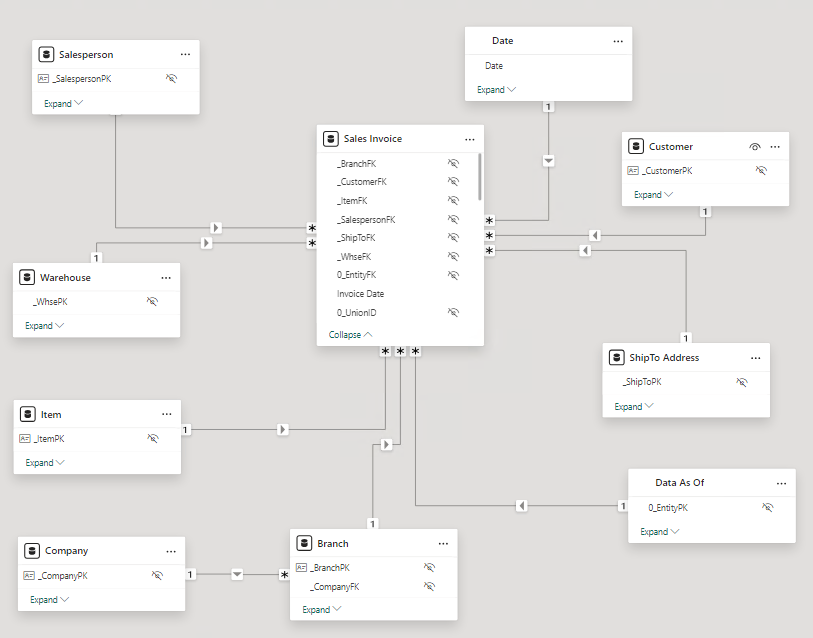
Example of a Production Star Schema
The following exemplifies how the Sales Invoice DFT+ tables are linked in DataSelf’s out-of-the-box templates in a star schema arrangement. This model works in reporting tools such as Power BI, Tableau, Excel, and AI tools such as Claude and ChatGPT.
DFT+ Galaxy Schemas
A key benefit of a galaxy schema is its ability to support reporting across multiple fact tables using shared dimensions within a single report. This enables users to analyze different business processes—such as sales, purchasing, inventory, and finance—from a consistent, unified perspective.
In a galaxy schema, not every shared dimension is necessarily related to every fact table. For example, the Chart of Accounts (CoA) dimension may be linked to financial fact tables but not to an Opportunity fact table, since opportunities typically do not have accounting entries.
This flexible design allows each fact table to include only the dimensions that are relevant while still providing a consistent analytical model across the data warehouse.
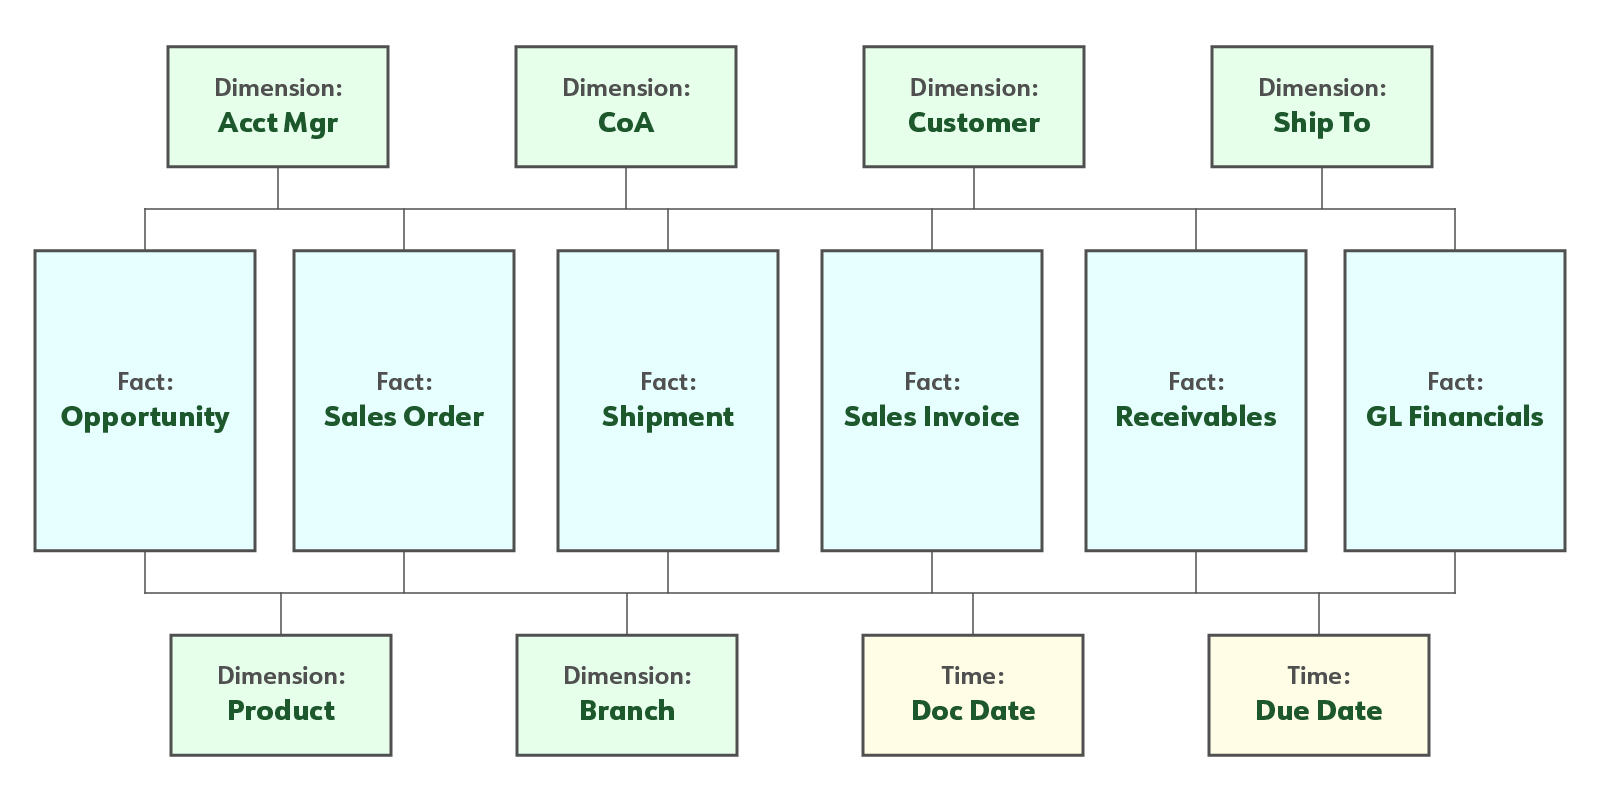
Simplified Example
This example illustrates six fact tables sharing six dimension tables and two time dimensions.
Example of a Production Galaxy Schema
The following exemplifies how DFT+ tables are linked in DataSelf’s out-of-the-box templates in a galaxy schema arrangement. This works in reporting tools such as Power BI, Tableau, Excel, and AI tools such as Claude and ChatGPT.
Stage 4 - Downstream (Report, Dashboard, and KPI Templates)
This is comprised of KPI+, our extensive and customizable library of report, dashboard, and KPI templates that plug-and-play to Stage 3.
Click the following links to learn more:
Key Words: single source of the truth, ETL templates, data warehouse templates, analytics templates, tds, tdsx, twb, twbx, pibx.