
Links to the Orange_Training workbook views:
Workbook: DataSelf Analytics v2201: Hot, Workbook: DataSelf Analytics v2201: Cold, DataSelf Analytics v2201: Slicer
-
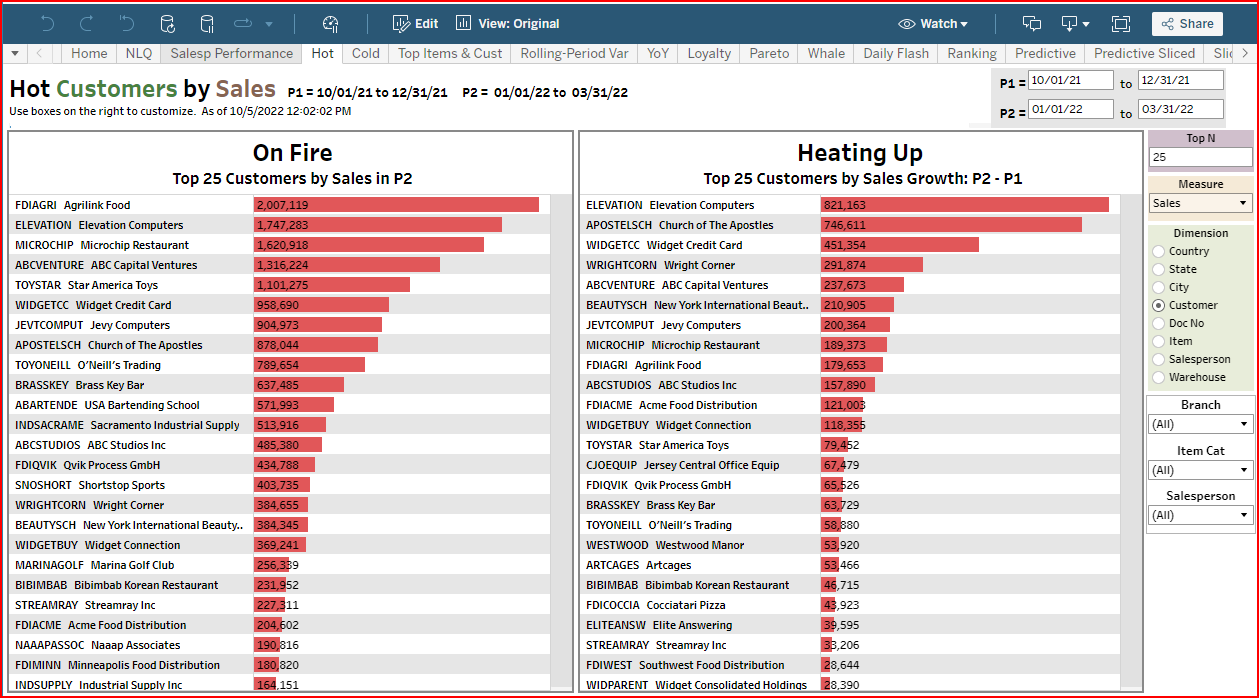
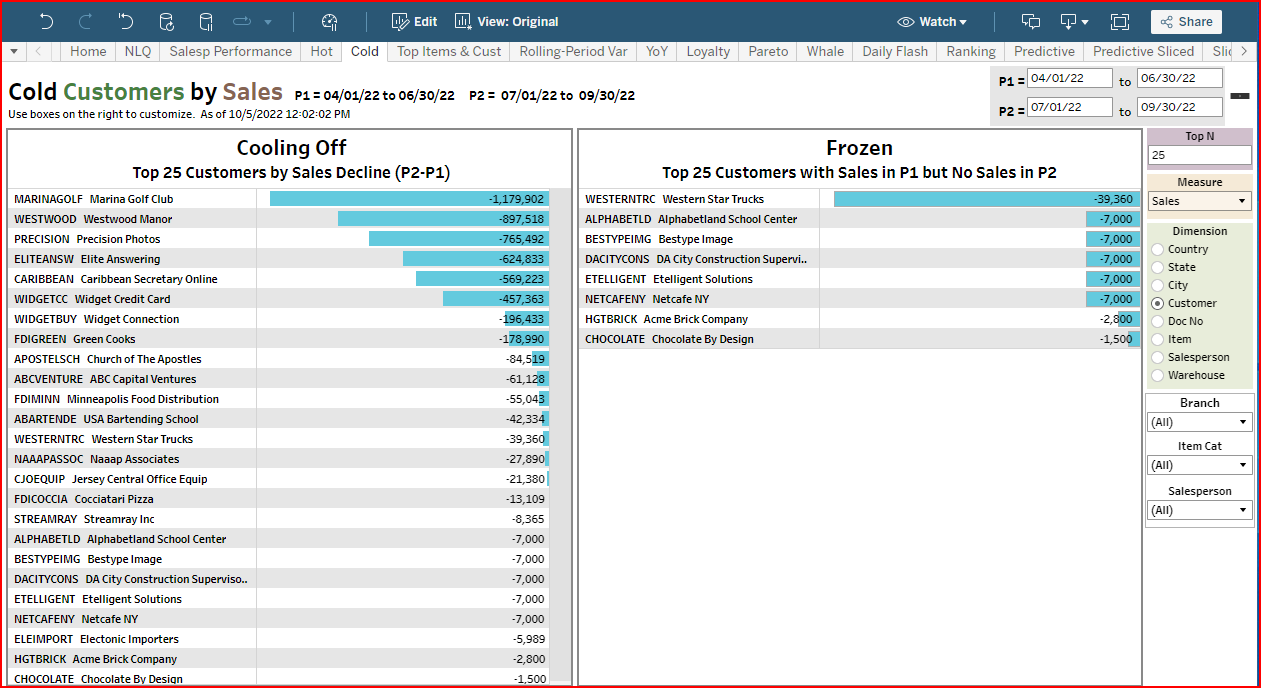
The Hot & Cold views show changes in Sales, Cost of Sales, Gross Profit, or Qty Sold between two selected time periods.
See the Measure selection on the right. -
The data can be grouped by Country, State, City, Customer, Doc No, Item, Salesperson, or Warehouse.
See the Dimension selection on the right. -
The data sorts in descending value of the measure; highest to lowest for the top number or records you choose.
See the Top N selection on the right. -
The data can be filtered by Branch, Item Category, and Salesperson.
See the Filter selections on the right.
-
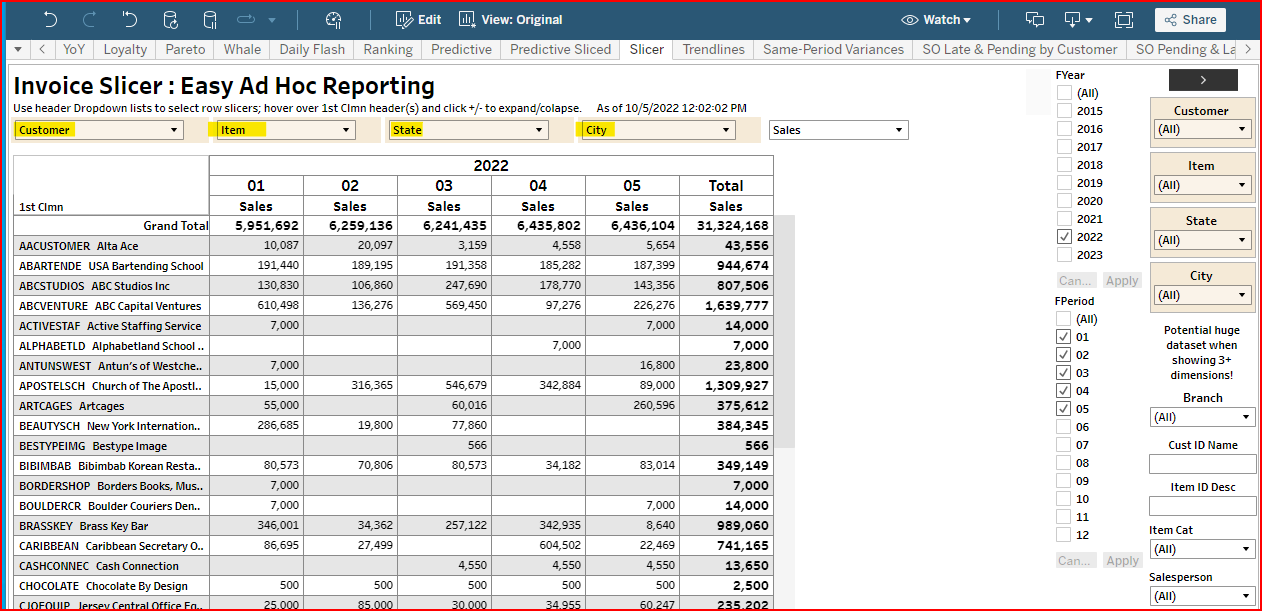
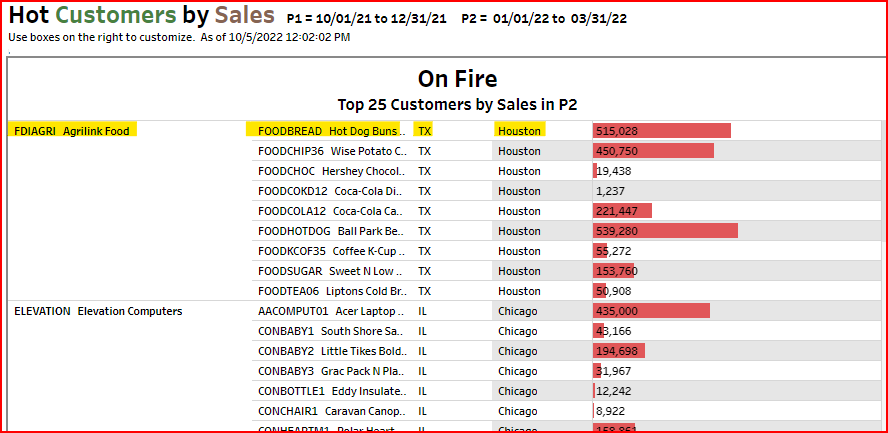
The Dimension has a drilldown hierarchy based on the Column 1 - 4 selections of the Slicer worksheet view
-
The Hot & Cold views are versatile tools to monitor changes in patterns over custom time periods, not simply Year of Year.
-
Saving Custom Views enables the viewer to quickly see the data from different angles with minimal manual entry.
Related page: How to save a custom view - DataSelf