
Click here to learn about Power BI and Tableau report and dashboard templates for NetSuite.
DFT+ (Dimension, Fact, Time) modeling separates operational system complexity from the analytics layer, providing organizations with trusted data for reporting, planning, and AI-driven decisions.
Within DFT+, a SPOT (Single Point of Truth) defines the authoritative dataset for each core distribution concept — such as Customer, Item, Warehouse, Vendor, Sales Order, Inventory Position, and Revenue, Cost of Sales, GP, and Quantity metrics.
Each SPOT is implemented as a curated data-warehouse table, view, or calculation that uses SQL to deliver clean, clearly named fields — primary keys, foreign keys, and analysis attributes — ensuring dashboards, KPIs, and AI models remain stable even when source systems change.
Tables
Subject to change without notice.
Important: DataSelf DFT foundation is ERP agnostic - click here to learn more.
|
Source |
Table Name |
|---|---|
|
NetSuite |
2.0_transaction |
|
NetSuite |
2.0_TransactionAccountingLine |
|
NetSuite |
2.0_transactionLine |
|
NetSuite |
classification |
|
NetSuite |
Customer |
|
NetSuite |
customerAddressbookEntityAddress |
|
NetSuite |
customerCategory |
|
NetSuite |
employee_SalesRep |
|
NetSuite |
inventoryItemLocations |
|
NetSuite |
item |
|
NetSuite |
itemType |
|
NetSuite |
Location |
|
NetSuite |
LocationType |
|
NetSuite |
PreviousTransactionLink |
|
NetSuite |
Subsidiary |
|
NetSuite |
transaction |
|
NetSuite |
TransactionAccountingLine |
|
NetSuite |
transactionLine |
|
NetSuite |
unitsTypeUom |
|
NetSuite |
Vendor |
|
Data Warehouse |
_D_Company |
|
Data Warehouse |
_D_Branch |
|
Data Warehouse |
_D_Customer |
|
Data Warehouse |
_D_CustAddress |
|
Data Warehouse |
_D_GL_Acct |
|
Data Warehouse |
_D_GL_SubAcct |
|
Data Warehouse |
_D_Item |
|
Data Warehouse |
_D_Location |
|
Data Warehouse |
_D_Salesperson |
|
Data Warehouse |
_D_Vendor |
|
Data Warehouse |
_D_Warehouse |
|
Data Warehouse |
_F_AR_Aging_Today |
|
Data Warehouse |
_F_Cash_Flow_Projection |
|
Data Warehouse |
_F_IN_Inventory_Planning |
|
Data Warehouse |
_F_IN_On_Hand_Today |
|
Data Warehouse |
_F_IN_On_Hand_History |
|
Data Warehouse |
_F_Purchase_Order |
|
Data Warehouse |
_F_Sales_Invoice |
|
Data Warehouse |
_F_Sales_Order |
|
Data Warehouse |
_T_DataAsOf |
|
Data Warehouse |
_T_Today |
|
Data Warehouse |
_T_Date |
|
Data Warehouse |
INz_10_Inventory_Planning |
|
Data Warehouse |
TransactionHdr_PO |
|
Data Warehouse |
TransactionHdr_SI |
|
Data Warehouse |
TransactionHdr_SO |
|
Data Warehouse |
TransactionLine_PO |
|
Data Warehouse |
TransactionLine_SI |
|
Data Warehouse |
TransactionLine_SO |
|
Data Warehouse |
TransactionHdr_ |
Notes:
-
Some of the above tables will only be deployed using customized SOWs or via services.
-
All NetSuite tables can be extracted into the data warehouse using an ODBC.
-
We only recommend extracting tables that are important for your reporting purposes.
Table Columns Example
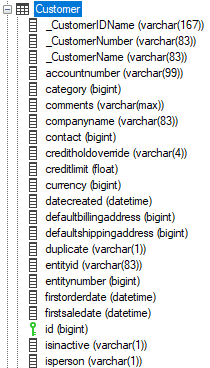
The following is an example of an Intacct table and its column names, indexes, and formatting in ETL+.
Column green icons indicate the data type and/or index definition have been set or changed in ETL+.
Delta Load Example
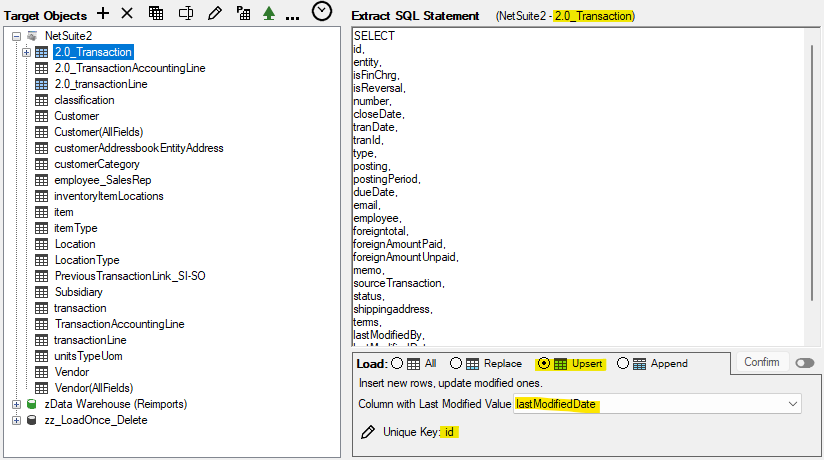
DataSelf ETL+ templates include delta load configuration for popular large tables. This dramatically reduces the time to refresh the data warehouse. ETL+ Table Load Types.
The following is an example of a table configured to use the Upsert feature.
Star and Galaxy Schema
Stage 3 Analytics turns Stage 2 data into fast, ready-to-use datasets. Depending on the use case, this stage is implemented in the data warehouse and/or in tools such as Power BI, Tableau, Excel, and AI tools (such as Claude and ChatGPT).
DFT+ Star Schemas
Key benefits of a well-designed Star Schema include simplicity, flexibility, high performance, and a single version of the truth. It organizes data around a single fact table connected directly to its related dimension tables, making reports and data analysis easier to build, understand, maintain, and optimize for performance.
A star schema focuses on a single business process, such as Sales, Purchasing, Inventory, or General Ledger. Each dimension is directly related to the central fact table, creating a simple, intuitive structure that is ideal for most dashboards and reports.
Star schemas are easier to maintain, deliver excellent query performance, and provide a solid foundation for self-service analytics. As reporting requirements expand to span multiple business processes, multiple star schemas can be combined into a galaxy schema by sharing common dimensions.

DFT+ Galaxy Schemas
A key benefit of a galaxy schema is its ability to support reporting across multiple fact tables using shared dimensions within a single report. This enables users to analyze different business processes—such as sales, purchasing, inventory, and finance—from a consistent, unified perspective.
In a galaxy schema, not every shared dimension is necessarily related to every fact table. For example, the Chart of Accounts (CoA) dimension may be linked to financial fact tables but not to an Opportunity fact table, since opportunities typically do not have accounting entries.
This flexible design allows each fact table to include only the dimensions that are relevant while still providing a consistent analytical model across the data warehouse.