
Children pages:

Introduction
AI is only as trustworthy as the data beneath it.
DataSelf AI+ combines DataSelf’s embedded AI capabilities with DataSelf MCP+ and leading large language models (LLMs). Together, they simplify and improve data preparation, reporting, and analysis for technical and business users while enabling new agentic AI possibilities.
DataSelf AI+ includes:
-
AI-assisted SQL and data modeling to help analysts address advanced reporting and analytics requirements
-
AI-assisted KPI creation to help executives and decision-makers define specialized business metrics
-
DataSelf MCP+ to connect curated, governed BI and data warehouse data with AI assistants, agents, and tools
-
Conversational analytics that enables business users to query data and generate insights using natural language
-
Agentic reporting and analytics that can monitor KPIs, identify anomalies, investigate contributing factors, generate recurring reports and summaries, recommend next steps, and initiate approved workflows
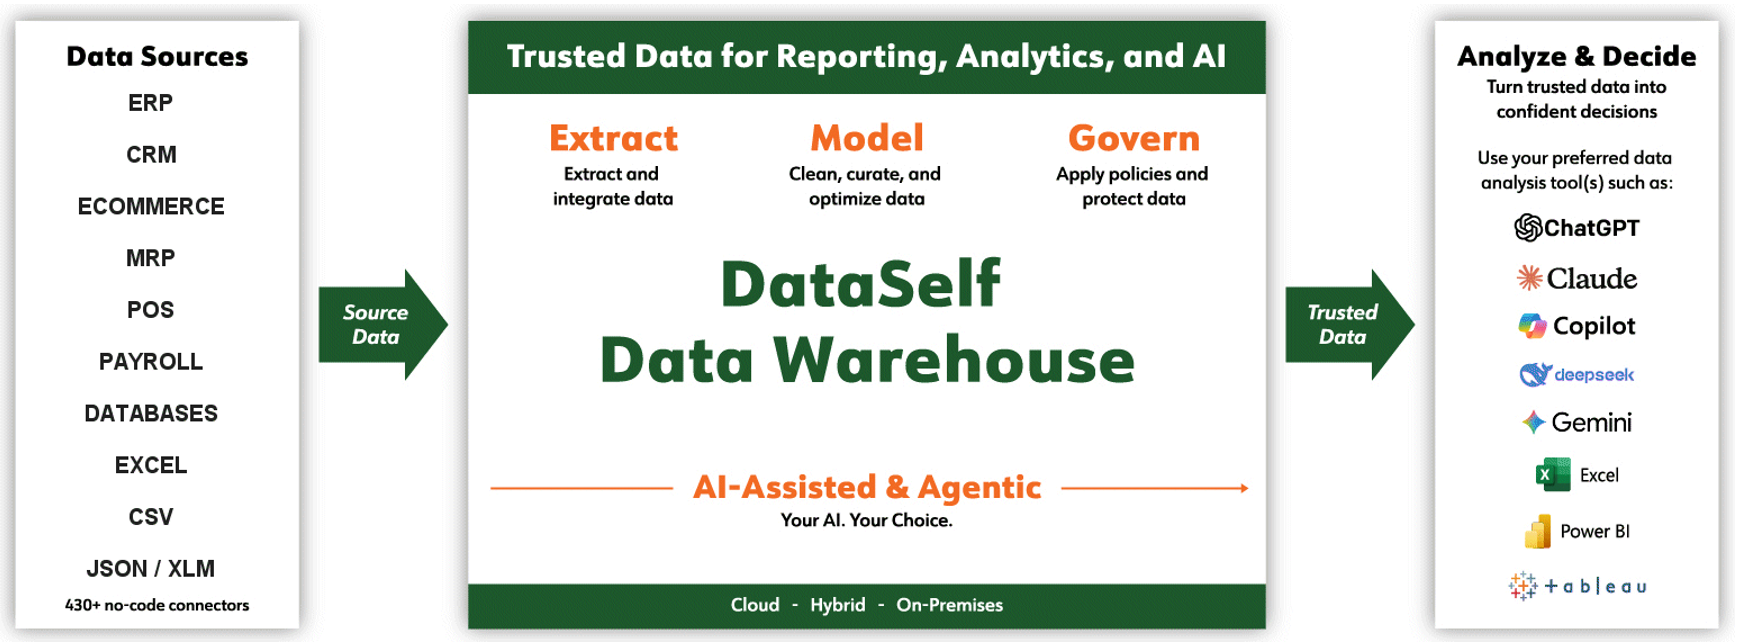
Why AI Needs Trusted Data
DataSelf AI+ combines conversational analytics with automated data warehousing, cleansing, optimization, and DFT+ (Dimension, Fact, and Time) modeling — enabling fast, governed, and curated data for accurate business insight.
-
AI hallucinations caused by fragmented transaction data such as from ERP, CRM, and payroll.
-
AI must sit on top of governed business data.
-
AI+ powers ETL+ and DFT+ to extract and model your data into consistent KPIs that feed insights.
-
By defining your SVOT (Single Version of the Truth) via SPOTs (Single Points of Truth) on your data warehouse, you guarantee curated, fast, low token-consumption data for BI and AI insights.
What Makes DataSelf AI+ Different
-
Connect supported AI assistants, including ChatGPT, Claude, Gemini, and Microsoft Copilot, to curated DataSelf data through MCP+.
-
Define and manage business rules in DataSelf with no-code, low-code, or full-code options.
-
Compare AI working directly with business sources against AI working with DataSelf’s governed data and models.
|
Capability |
AI without DataSelf |
AI with DataSelf |
|---|---|---|
|
Business Data Access |
Reads disconnected documents, databases, and APIs |
Unified, curated, governed data warehouse / data lake |
|
Business Logic |
Must infer business rules from prompts (potentially unreliable) |
|
|
Accuracy & Consistency |
Responses may vary between prompts |
Consistent, governed models, metrics and KPIs |
|
Results foundation |
Responses based on available context |
Responses grounded in deterministic business rules |
|
Business Context |
Requires users to explain their business and underlying data |
Built on ERP, CRM, accounting, and operational data models. |
|
Analytics Readiness |
Requires prompt engineering and validation |
Business-ready reports, KPIs, dashboards, and ad hoc analytics |
|
Hallucination Risk |
Higher |
Lower |
|
Performance |
Depends on source systems and prompt complexity |
Optimized analytical data warehouse for fast queries |
|
AI Token Usage |
Higher due to verbose prompts and schema discovery |
Lower through curated models and business-friendly metadata |
|
AI Portability |
Reports or analyses may remain tied to a particular AI workflow |
Reports saved in DataSelf can be maintained with different LLMs |
|
Your AI Context |
Can lack the context from your preferred LLM |
Leverages your LLM’s context to better understand your prompts |
|
Security |
Limited and time consuming |
Enterprise-grade framework |
|
Scalability |
Ad hoc and user dependent |
Standardized, reusable analytics across the organization |
Examples of AI-assisted Insights with DataSelf
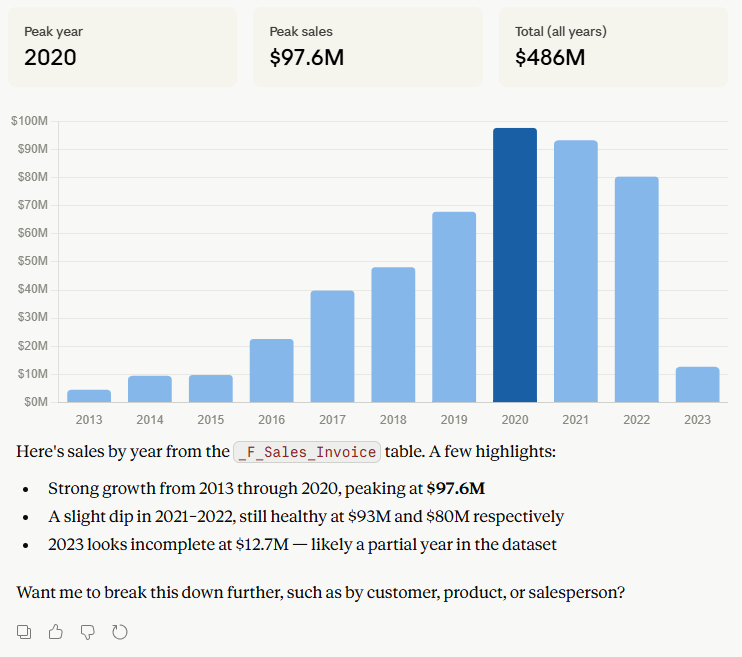
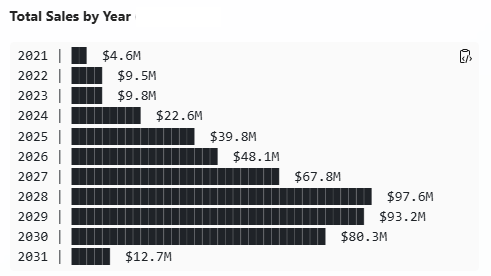
Prompt 1: “Show sales by year from the DataSelf DW”
Prompt 2 (Click here to interact with the demo dashboard below):
“Create a dashboard with three coordinated visualizations from MCP+:
- Top-left chart: Sales by Year — Stacked Bar Chart. Display total sales by year, using one bar for each year. Segment each bar by Ship-To State and assign a consistent color to each state.
- Top-right chart: Sales by Ship-To State on a U.S. Map. Display total sales by Ship-To State on a U.S. map. Label each state with its state code and total sales. Use the same state colors assigned in the stacked bar chart.
- Bottom table/grid: Sales by Ship-To State by Year. Display Ship-To State on the rows and Year on the columns. Include totals for every row and column. Allow users to sort the table by clicking any column header.
Interactivity:
- Filter by state on the map: Clicking a state on the map filters the yearly bar chart to show only that state.
- Filter by year on the bar chart: Clicking a year’s bar filters the map to show sales for that year.
- Highlight active selections: Visually highlight the selected state or year on the visualizations.
- Filter by year dropdown: Add a multi-select year dropdown at the top of the dashboard.
- Download to Excel: Add a button to download the grid to Excel.”
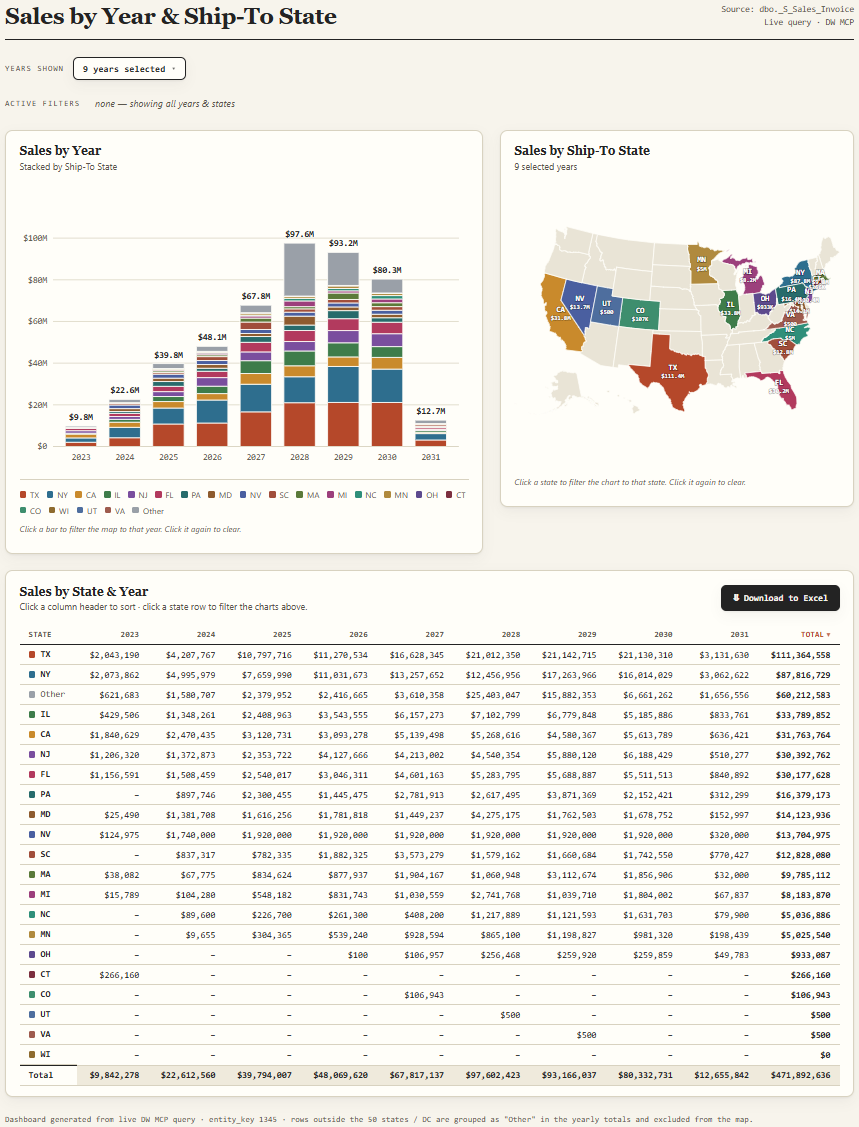
Note: asking the same prompt can render different results. Continue to prompt to adjust the results.
Industry Focused
Includes templates customized for several industries such as:
-
Construction
-
Distribution
-
Manufacturing
-
Professional services
-
Field services
Deployment Options
-
Supports Azure, AWS, other cloud providers, and on-premises
-
Can run behind the client firewalls
-
Optional dedicated architecture
-
Supports HIPAA/FedRAMP-oriented deployments
-
O365 authentication support
MCP Server (Model Context Protocol)
DataSelf MCP+ for Data Warehousing & Analytics