
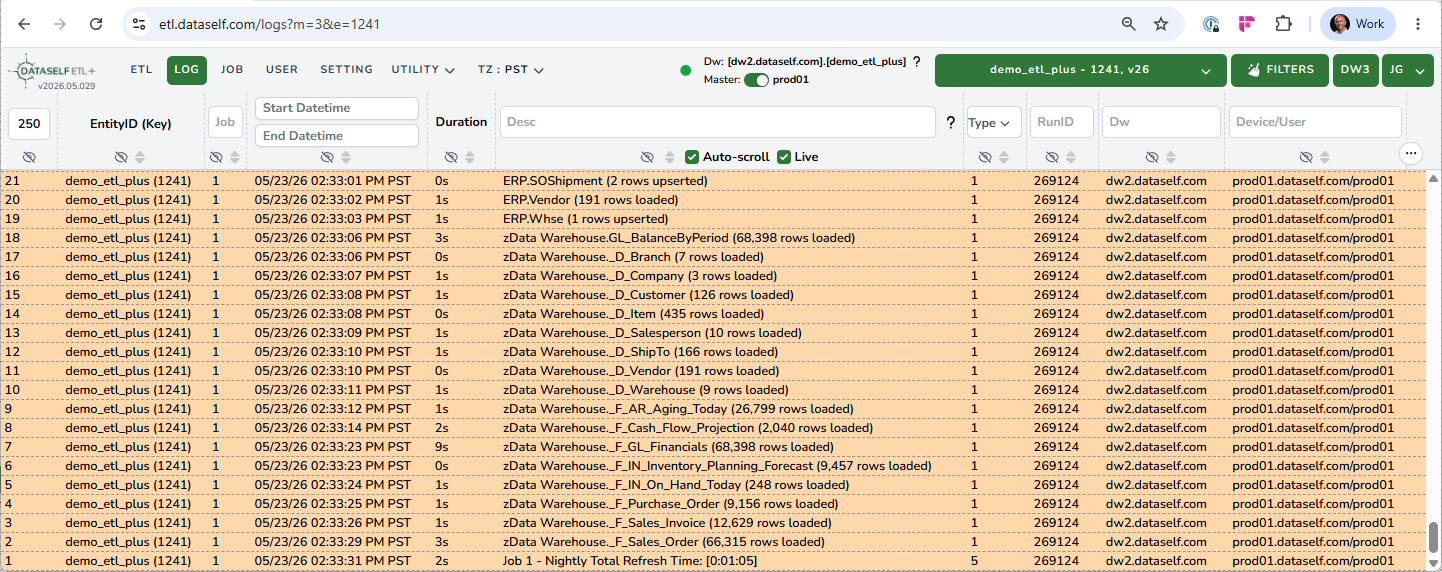
The following is a sample screenshot from the LOG page:
-
Number of Log Rows showing / Index
-
Enter a new number and press Enter to load a different of number of log rows.
-
Index =1 at the bottom of the list, and it increases going up.
-
-
Entity ID (Key): shows <Entity ID> (<Entity Key>) per line.
-
Job: Enter a Job ID and press Enter to filter the log rows accordingly.
-
Date Time:
-
Shows the date and time for each line.
-
The time zone can be customized using the TZ header dropdown.
-
By default, it shows the latest Log rows.
-
Use the Start and End boxes to define a different log period than the default.
-
-
Duration
-
Shows the duration by individual log row.
-
Use the sort icon to quickly view the longest log steps. You might also want to increase the number of Log Rows to capture all relevant log steps.
-
-
Description
-
Shows the description for each log row. It can over beginning and end of Jobs, user actions, as well as object loading.
-
It shows the following for table loading: <Source Name>.<Object Name> (<number of rows> rows <load type>). Example from the sample screenshot: ERP.Whse (1 rows upserted)
-
-
Type: Use this dropdown to select the log types to show
-
RunID: When applicable, shows the log section RunID.
-
Dw: Shows the data warehouse’s SQL instance.
-
Device/User: When applicable, shows the device name and Windows user running the ETL+ Windows Service where the log row ran.
-
Icons under the header labels:
-
Hide column (use
…on the far right to reset hidden columns) -
Sort: Click the Sort icon on a column header to order the list by this column plus the DateTime column.
-
Auto-scroll: This checkbox is only relevant when the Live checkbox is ON. In this case, uncheck the Auto-scroll box to prevent the list from auto-scrolling as new log lines are added to the bottom of the list.
-
Live: When checked, it’ll auto populate new log lines to the bottom of the list.
-
…on the far right:-
Reset Size/Hide columns
-
Export to CSV
-
-