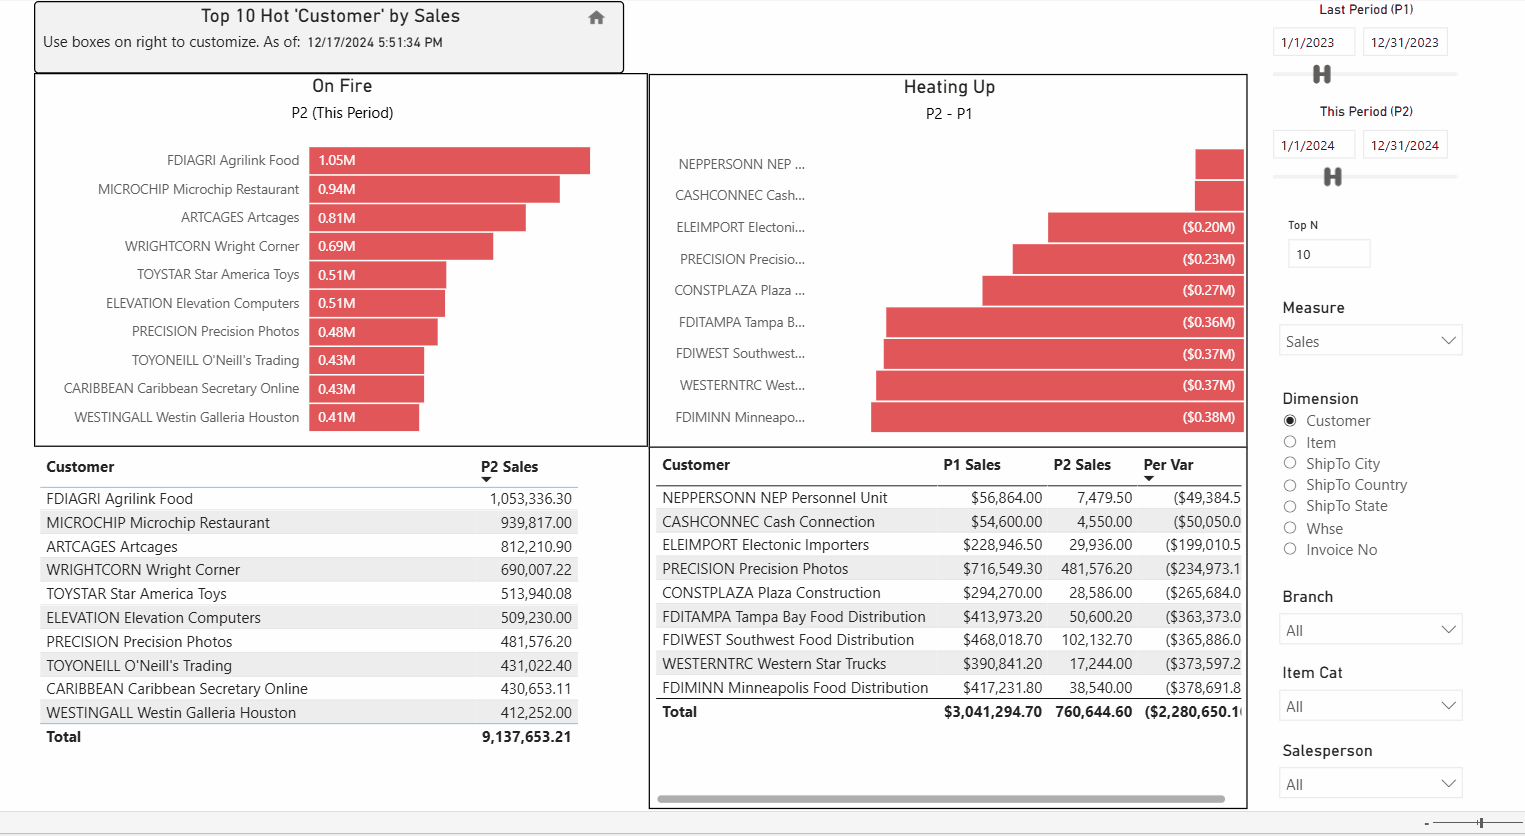
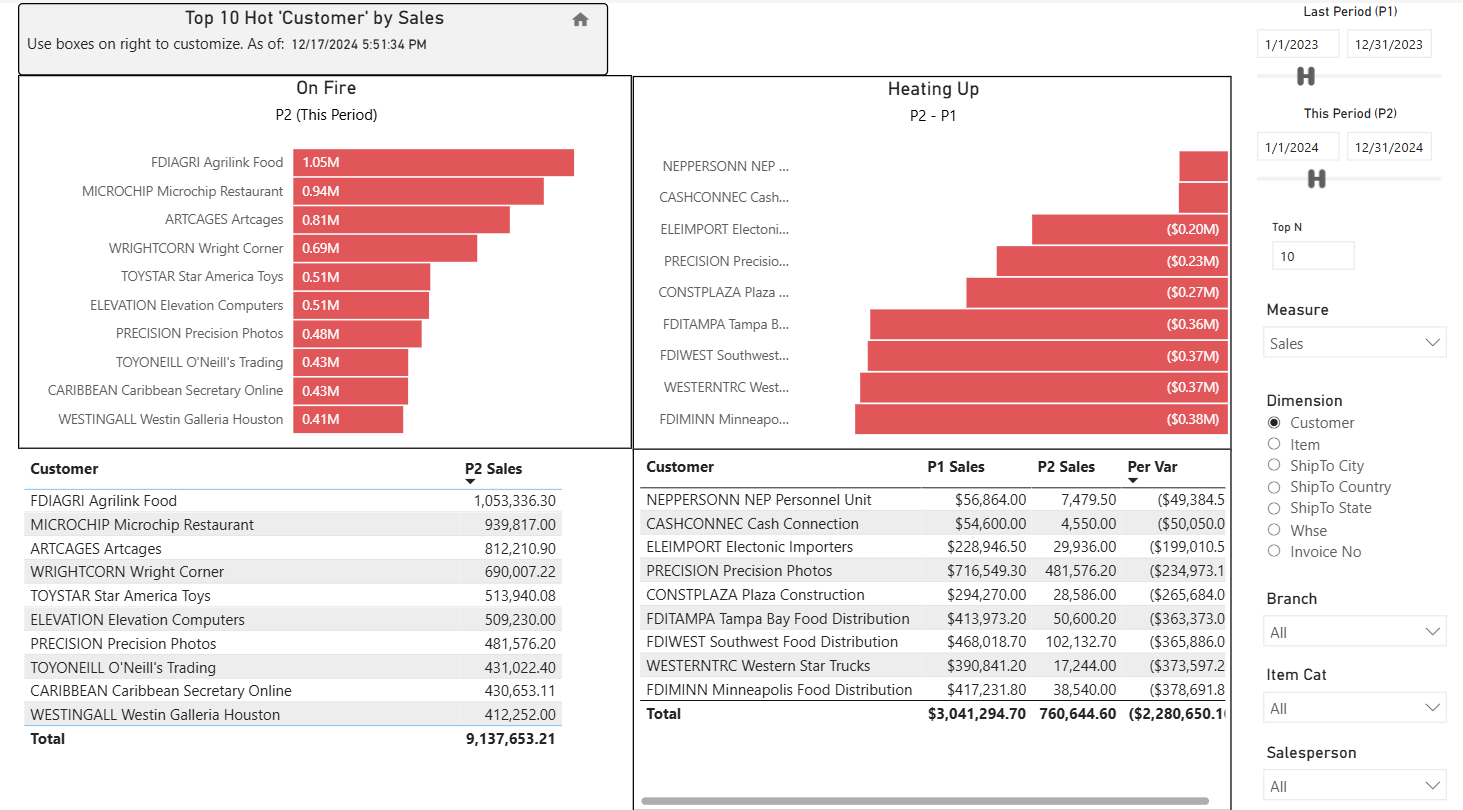
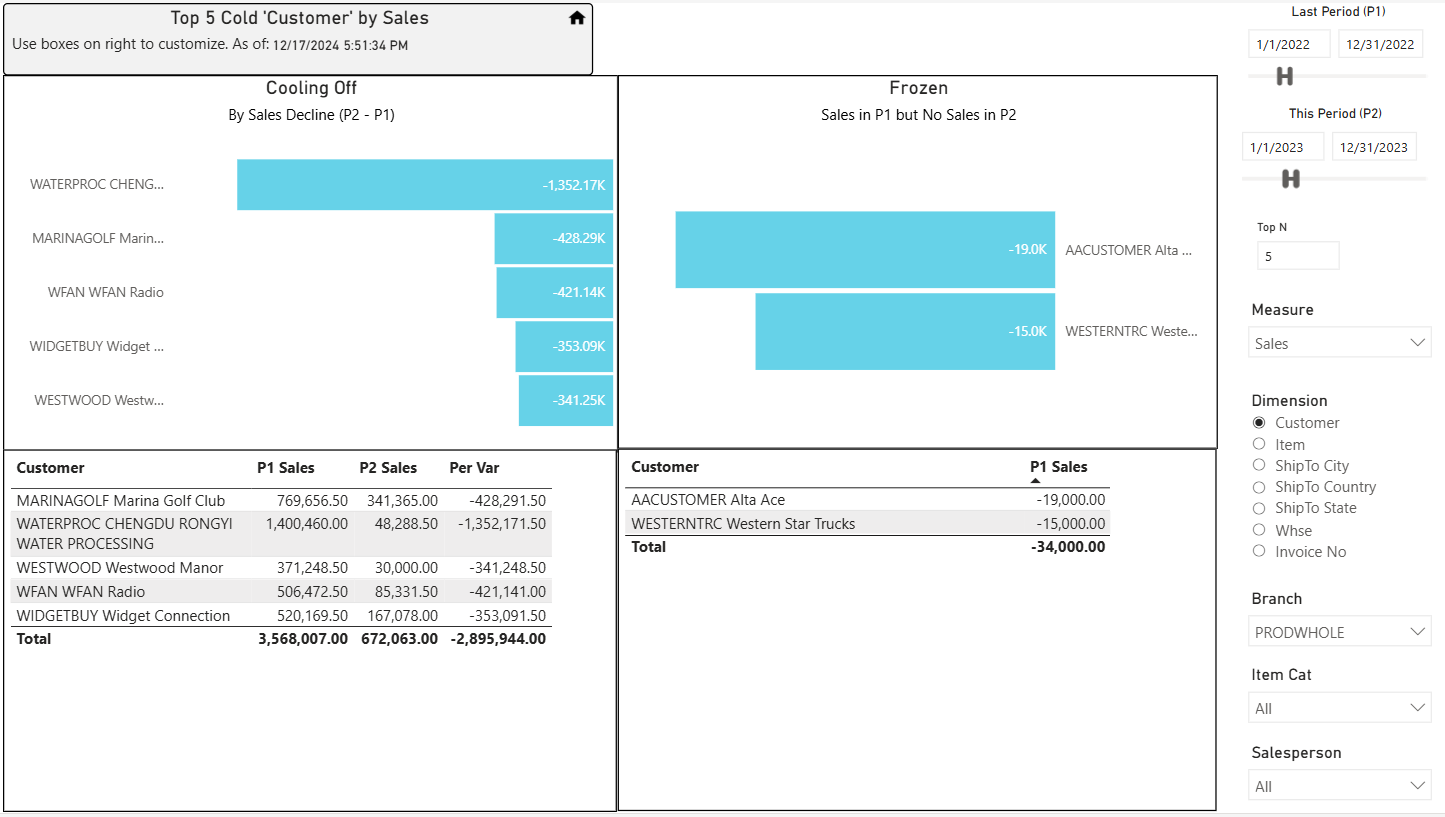
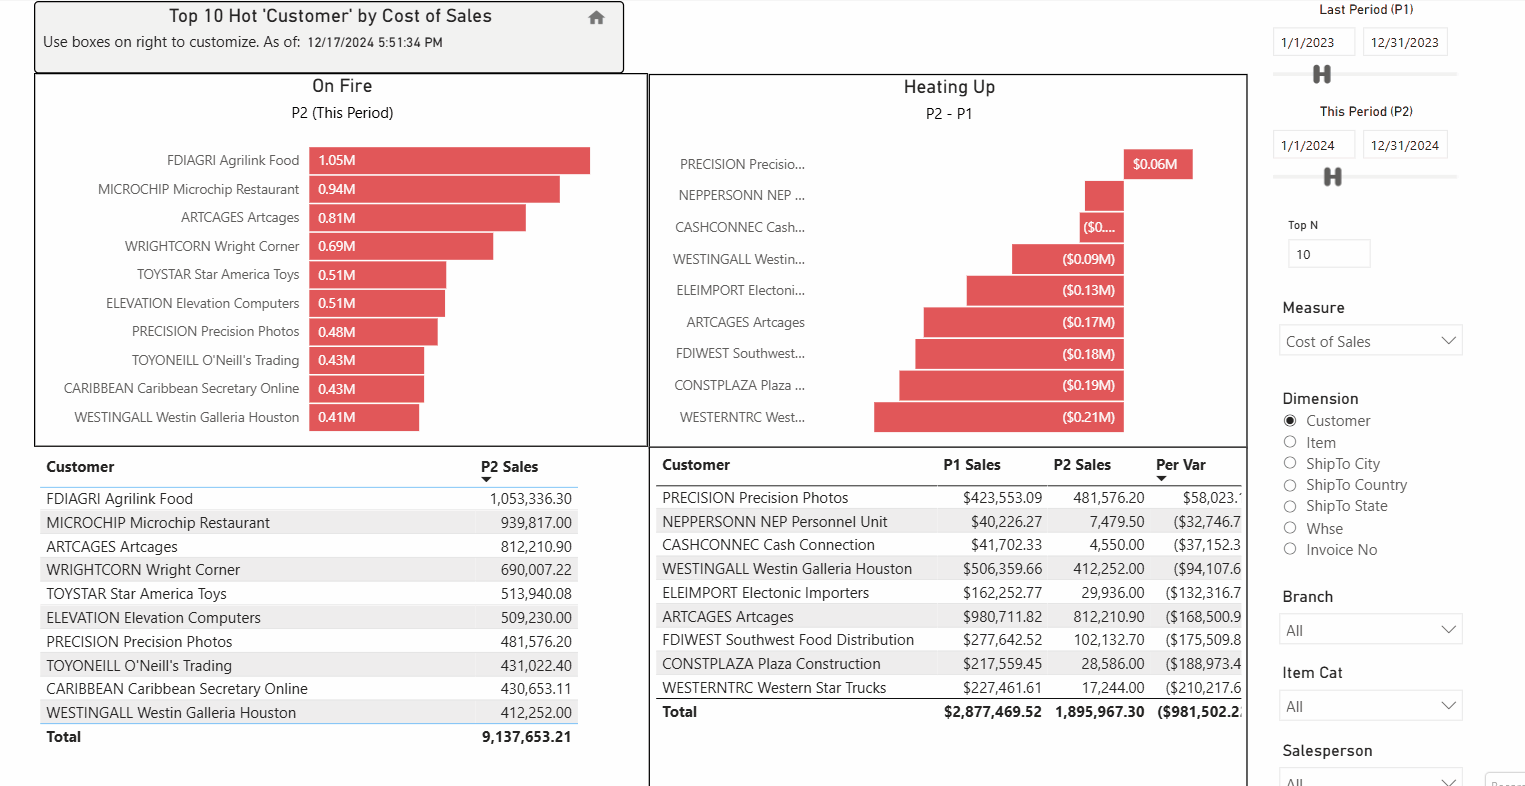
The Hot & Cold views compare the selected metric across two time periods to identify positive or negative trends.
-
Hot: The selected metric increased between the two periods.
-
Cold: The selected metric decreased between the two periods.
-
The Hot & Cold views show changes in Sales, Cost of Sales, Gross Profit, or Qty Sold between two selected time periods.
See the Measure selection on the right. -
The data can be grouped by Country, State, City, Customer, Doc No, Item, Salesperson, or Warehouse.
See the Dimension selection on the right.
-
The data sorts in descending value of the measure; highest to lowest for the top number or records you choose.
See the Top N selection on the right. -
The data can be filtered by Branch, Item Category, and Salesperson.
See the Filter selections on the right.