
Overview — DFT+ for Distribution Companies
Distribution companies operate across multiple operational systems — ERP, WMS, CRM, eCommerce, EDI, logistics, and supplier platforms. Each system captures transactions differently, creating inconsistencies that make reporting fragile and difficult to scale.
DFT+ (Dimension, Fact, Time) modeling separates operational system complexity from the analytics layer, providing distributors with stable, trusted data for reporting, planning, and AI-driven decisions.
Within DFT+, a SPOT (Single Point of Truth) defines the authoritative dataset for each core distribution concept — such as Customer, Item, Warehouse, Vendor, Sales Order, Inventory Position, and Revenue, Cost of Sales, GP, and Quantity metrics.
Each SPOT is implemented as a curated data-warehouse table, view, or calculation that uses SQL to deliver clean, clearly named fields — primary keys, foreign keys, and analysis attributes — ensuring dashboards, KPIs, and AI models remain stable even when source systems change.
Example — Customer SPOT
The Customer SPOT centralizes all attributes required for customer and channel analysis.
Data may originate from multiple sources:
-
ERP → Customer ID, credit terms, pricing class, billing information
-
CRM → industry, lead source, account owner
-
eCommerce → channel classification and digital behavior
-
EDI systems → trading partner identifiers
-
External datasets → territories, market segmentation, or enrichment data
The SPOT harmonizes and deduplicates customers across systems, enabling consistent analysis of:
-
customer profitability
-
channel performance
-
sales territory reporting
-
acquisition vs. retention trends
-
consolidated reporting after acquisitions or system migrations
Why DFT+ Matters for Distribution
Distribution businesses constantly evolve:
-
ERP upgrades or replacements
-
Warehouse expansions
-
Multi-company consolidations
-
New sales channels (eCommerce, marketplaces, EDI)
-
Supplier and logistics integrations
One of the primary goals of DFT+ is to keep reporting, analytics, and AI models stable through these changes.
Instead of rebuilding dashboards every time systems evolve, DFT+ preserves a consistent analytics foundation — allowing distributors to focus on improving operations, inventory turns, service levels, and margins rather than fixing reports.
Business Outcomes for Distributors
DFT+ enables reliable analysis across:
-
Inventory availability and turns
-
Fill rate and service performance
-
Gross margin by item, customer, or channel
-
Supplier performance and lead times
-
Order fulfillment efficiency
-
Demand trends and forecasting
By establishing SPOT datasets, distribution companies gain a durable analytics foundation that supports growth, system change, and data-driven decision making.
DFT+ Stages
Stage 1 — Source Mirroring: Creates a clean, fast, low-impact copy of raw source data, preserving lineage and keys.
Stage 2 — Data Warehouse: Builds the primary SPOTs (dimensions/facts) via SQL (or Python), applying cleansing and conformance, and defining clear columns plus surrogate/foreign keys..
Stage 3 — Analytics: Leverages analytics engines modeling (e.g., Domo, Looker, Power BI, Tableau), optimizing joins and aggregations where those tools perform best.
Stage 4 — Report, Dashboard, and KPI Templates: This is an extensive and customizable library of reports, dashboards, and KPIs that plug-and-play on Stage 3.
Stage 1 - Source Mirroring
DataSelf ETL+ is a powerful, easy-to-use tool for source mirroring.
You can design this Stage from scratch (click the following list of ETL+ 430+ No-code Data Sources), or accelerate optimized mirroring with our pre-mapped ETL+ Pre-mapped Source Systems.
Stage 2 - Data Warehouse
Stage 2 is housed in a SQL data warehouse (usually SQL tables/views). It transforms ERP-specific structures into the standardized model used by reports and dashboards (as in DataSelf Stages 3–4 templates).
Changing Stage 2 logic automatically propagates to all downstream reports and dashboards. For example, changing the Gross Profit calculation to absorb freight in Stage 2 will automatically show Gross Profit with freight absorbed in all downstream reports, dashboards, and AI models.
|
Table Name |
|
|---|---|
|
_D_Account |
CA, CO, CM, CT |
|
_D_Acct_Address |
CA, CO, CM, CT |
|
_D_Appointment |
FS |
|
_D_Branch |
All |
|
_D_Company |
All |
|
_D_CustAddress |
AR,CA,EO, ER,ES,ET,PM,SI,SO |
|
_D_Customer |
AR,CA,CF,IP,EO,ER,ES,ET,PM,SI,SO |
|
_D_CustomField |
TBD |
|
_D_eCommerce_Order |
EO |
|
_D_Employee |
PY |
|
_D_Equipment |
FS |
|
_D_GL_Acct |
AR, GF, GT, SI, SO |
|
_D_GL_SubAcct |
AR, GF, GT, SI, SO |
|
_D_Item |
EO, ER,ES,ET,IO, IH, IP, IT, PO, SI, SO |
|
_D_Lead |
CA, CM, CO, CT |
|
_D_Location |
IO, IH, IP, IT, PO, SI, SO |
|
_D_Marketing_Email |
CM |
|
_D_Opportunity |
CO |
|
_D_Project |
PM |
|
_D_Salesperson |
AR, CA, PM, SI, SO |
|
_D_ShipTo |
EO,ER,ES,IO, IH, IP, IT, PO, SI, SO |
|
_D_Technician |
FS |
|
_D_Territory |
CA,CO,CM,CT,EO,ER,ES |
|
_D_Ticket |
CT |
|
_D_Vendor |
AP, IT, PO |
|
_D_Warehouse |
IO, IH, IP, IT, PO, SI, SO |
|
_F_AP_Aging_Today |
AP |
|
_F_AR_Aging_Today |
AR |
|
_F_Cash_Flow_Projection |
CF |
|
_F_CRM_Contact_Activity |
CA |
|
_F_CRM_Marketing_Email |
CM |
|
_F_CRM_Opportunity |
CO |
|
_F_CRM_Ticket |
CT |
|
_F_eCommerce_Order |
EO |
|
_F_eCommerce_Returns |
ER |
|
_F_eCommerce_ShoppingCart |
ES |
|
_F_eCommerce_Traffic |
ET |
|
_F_GL_Financials |
GF |
|
_F_GL_Transaction |
GT |
|
_F_GoogleAnalytics |
GA |
|
_F_IN_Inventory_Planning |
IP |
|
_F_IN_On_Hand_Today |
IO |
|
_F_IN_On_Hand_History |
IH |
|
_F_IN_Transaction |
IT |
|
_F_Payroll |
PY |
|
_F_Project_Management |
PM |
|
_F_Purchase_Order |
PO |
|
_F_Sales_Invoice |
SI |
|
_F_Sales_Order |
SO |
|
_T_DataAsOf |
All |
|
_T_Date |
All |
|
_T_Period |
GF, GT, IH |
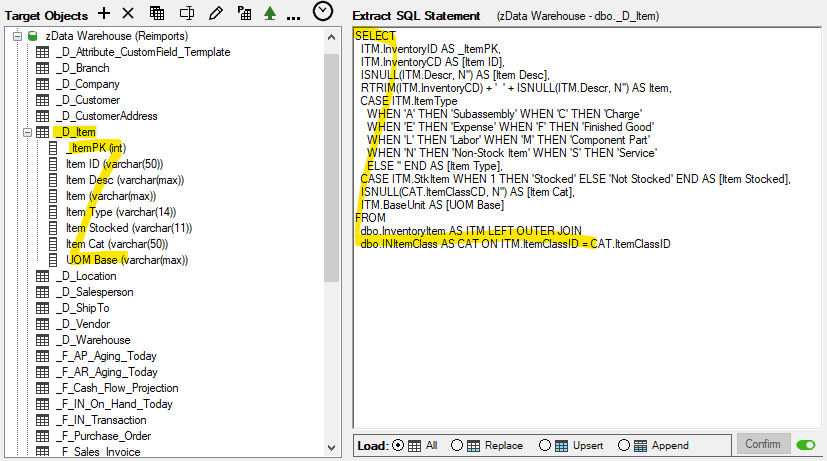
Stage 2 DFT+ - A SQL Statement Example
Example from ETL+ transformation: mapping ERP tables to the target _D_Item DFT+ table.
Stage 3 - Star and Galaxy Schemas
Implemented in conjunction of MS SQL, Power BI and/or Tableau, the DFT+ turns Stage 2 data into fast, ready-to-use datasets.
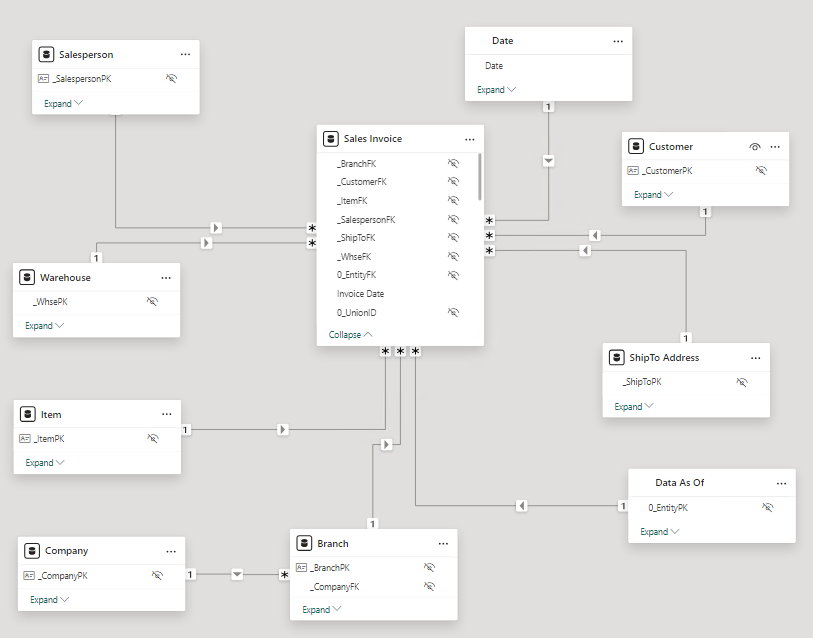
DFT+ Star Schema Example
The following exemplifies how the Sales Invoice DFT+ tables are linked in DataSelf’s out-of-the-box templates in a star schema arrangement. This model works in reporting tools such as Power BI, Tableau, and Excel.
DFT+ Galaxy Schema Example
The following exemplifies how DFT+ tables are linked in DataSelf’s out-of-the-box templates in a galaxy schema arrangement. This model works in reporting tools such as Power BI, Tableau, and Excel.
A key benefit of a galaxy schema is easy reporting across multiple fact tables in a single report. Click the image to zoom in.
Stage 4 - Downstream (Report, Dashboard, and KPI Templates)
This is comprised of KPI+, our extensive and customizable library of report, dashboard, and KPI templates that plug-and-play to Stage 3.
Click the following links to learn more:
Key Words: single source of the truth, ETL templates, data warehouse templates, analytics templates, tds, tdsx, twb, twbx, pibx.